Future Games Trials/Uncommitted Showcase: Trackman Breakdown (6/16)
June 30, 2021
Follow on Twitter: @PBRTennessee
Follow on Instagram: @pbrtennessee
Our first HS open event of the summer was the Future Games Trials/Uncommitted Showcase at Rose Park on June 16th. The Trackman B1 portable unit was purring and spitting out advanced ball flight metrics, including exit velocities and distance for all 50+ prospects. During the pitching session, the Trackman unit collected critical pitch metrics, such as velocity, spin rate, and movement data. We saw 5 arms that were 80+ on the mound, including a 2024 that topped at 86 with a spin rate in the 2400s. On the offensive side of things, we had 16 players top 90+ exit velo and 9 players average 80+ during the BP session. TrackMan is the global leader in ball-tracking accuracy. Following a Prep Baseball Report event, all players will get unrivaled access to their performance data in the Trackman interactive app. Below we look at key Trackman terms and categories leaders from the event.
Event News | Roster | Stat Analysis |
Interested in attending a PBR Tennessee event? Check out our schedule by clicking here.
Trackman Key Terms
Exit Velocity- this one's pretty simple but this metric measures the speed of the ball off the bat, measured in miles per hour (mph).
Distance- another simple one, this metric measures how far the ball traveled or would travel if it was not obstructed, measured in feet.
Launch Angle- measures the vertical angle of the ball as it leaves the bat. Positive numbers represent balls traveling upward off of the bat and negative numbers mean the ball is traveling downward off of the bat.
Fly Ball %- Percentage of fly balls hit during a given set of batted ball events. Trackman defines a fly ball as any batted ball with a launch angle between 25 degrees and 49.9 degrees.
Line Drive%- Percentage of line drives hit during a given set of batted ball events. Trackman defines a line drive as any batted ball with a launch angle between 10 degrees and 24.9 degrees.
Hard Hit%- Percentage of batted balls with an exit velocity of 90 MPH or higher.
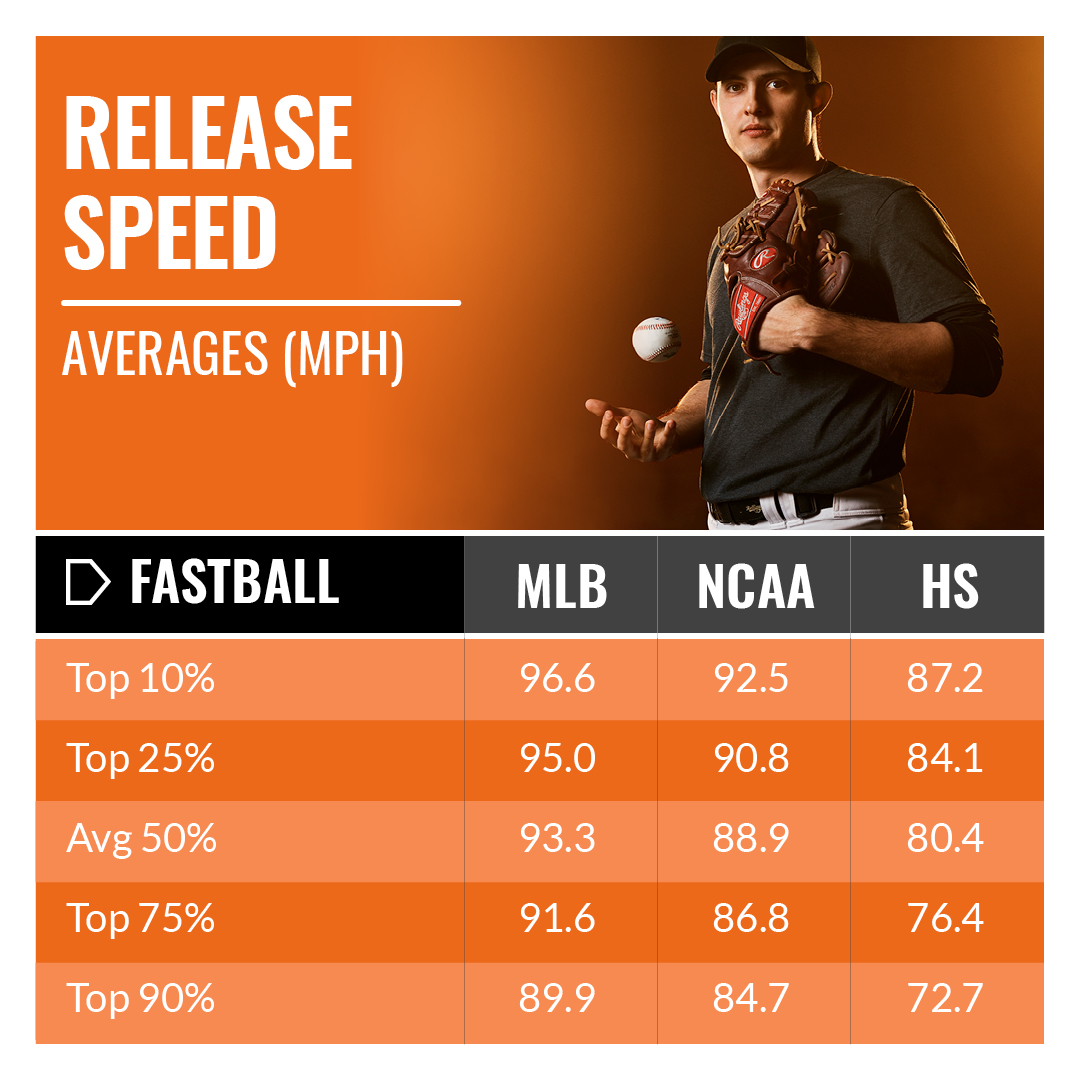
FASTBALL VELOCITY
Fastball velocity doesn't go much deeper than just looking at the numbers and comparing them to the graphic below! Fastball velocity complements just about all of the other metrics that are measured. If you throw hard, it makes all your other pitches/metrics even better.
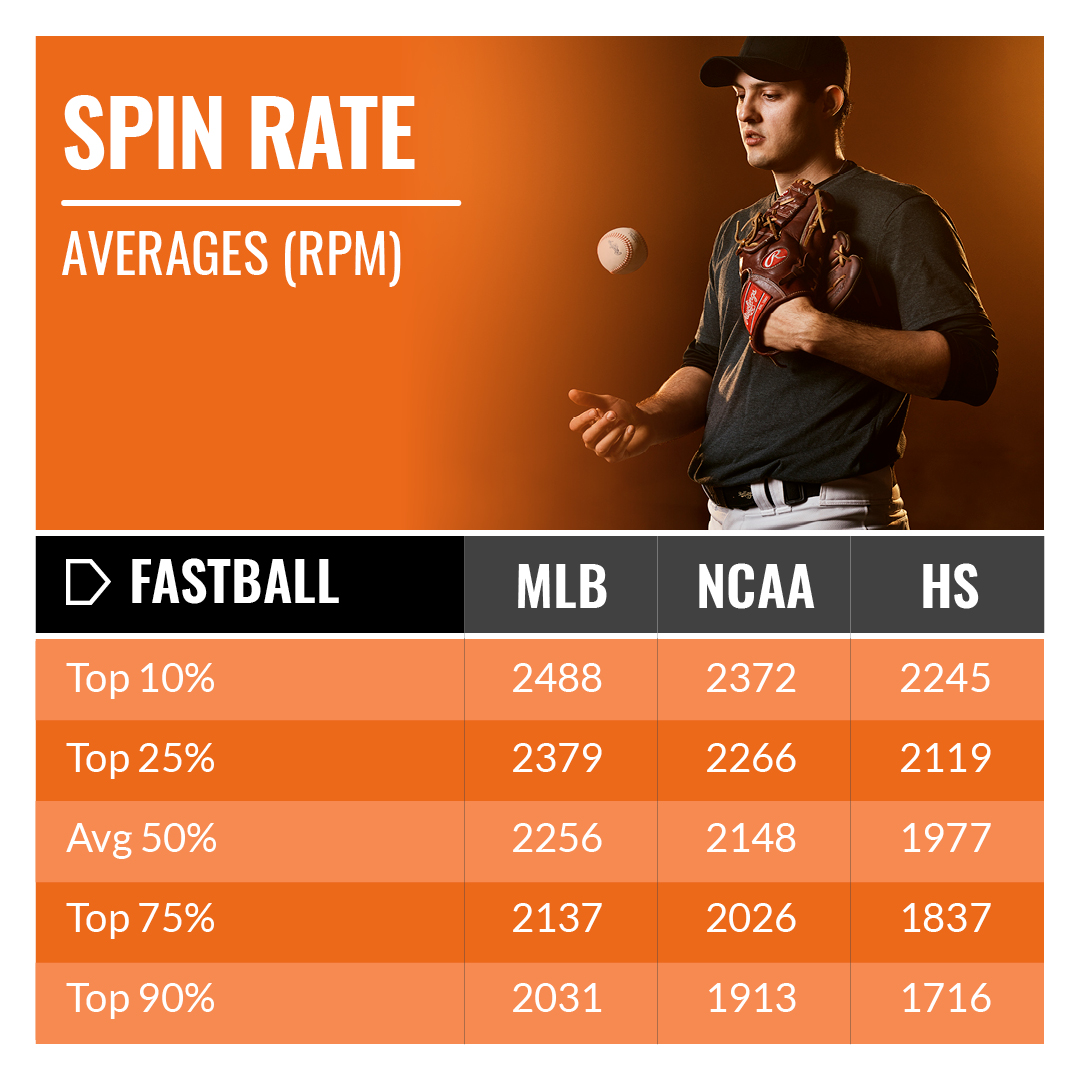
FASTBALL SPIN RATE
Spin rate is a measurement that if you are below average or above average, you can pitch with more room for error. On the other hand, if you are average you should try to throw in the bottom half of the zone with exceptional command. High spin fastballs profile as one that is frequently described as having "late life". Low spin fastballs tend to profile as a fastball that has heavy feel to it. Pitch movement is still dependent on spin direction of the pitch but Trackman does not have that metric displayed on profiles.
BAUER UNITS
Bauer Units are an easier way of determining how useful the spin numbers are compared to the velocity. We can calculate this metric by taking average spin rate and dividing it by average velocity. Bauer Units are useful because we can have a case of two pitchers with the same spin numbers, ex. 2200 RPM, but one pitcher throws 90 MPH and the other throws 83 MPH. The pitcher throwing 90 MPH with 2200 spin is not as impressive as the pitcher throwing 83 MPH with the same spin. Typically, we would tell the harder throwing pitcher to throw up in the zone purely off his velocity and his high spin, but because his Bauer Units would equate to around 24 that would be only 1 unit off of average (23), therefore he would want to hammer the bottom of the zone. On the other side, the pitcher throwing 83 MPH has a Bauer Unit measurement of 26 which is incredibly impressive. This would allow him to throw up in the zone even though his velocity is not blow away type numbers because he produces above average spin with that slated velocity.
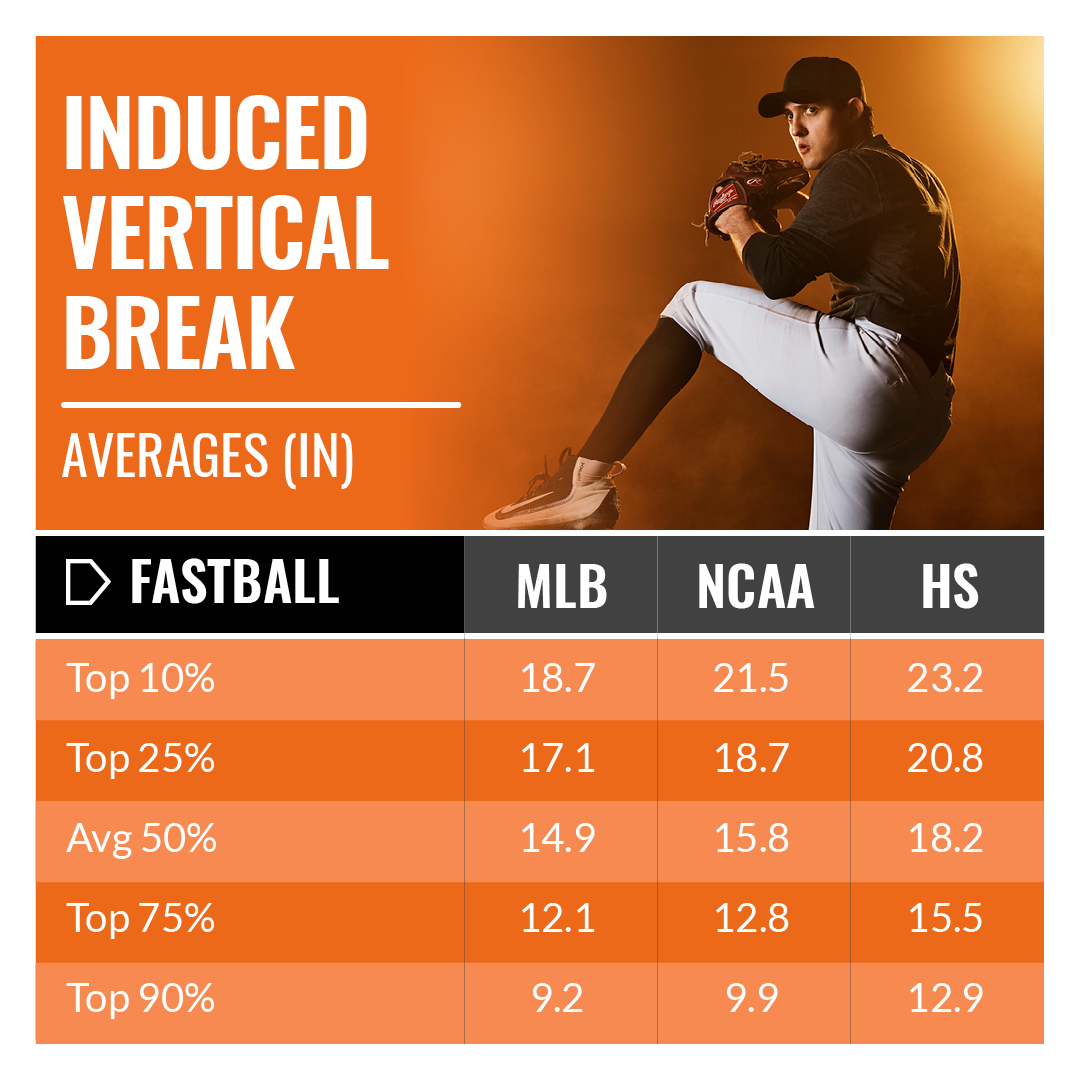
FASTBALL INDUCED VERTICAL BREAK
As far as deception and importance goes, fast induced vertical break (IVB) may be the most important. Induced vertical break is not what is sounds. IVB simply means the pitch is "breaking" upward from the average level a pitch falls from release to home plate. This is a stat that you want to stay away from being average at. Fortunately, this can be tweaked slightly depending on release height. To put it simply, the higher number = more "rise" the pitch has compared to average. Lower number = more depth the pitch has to it.
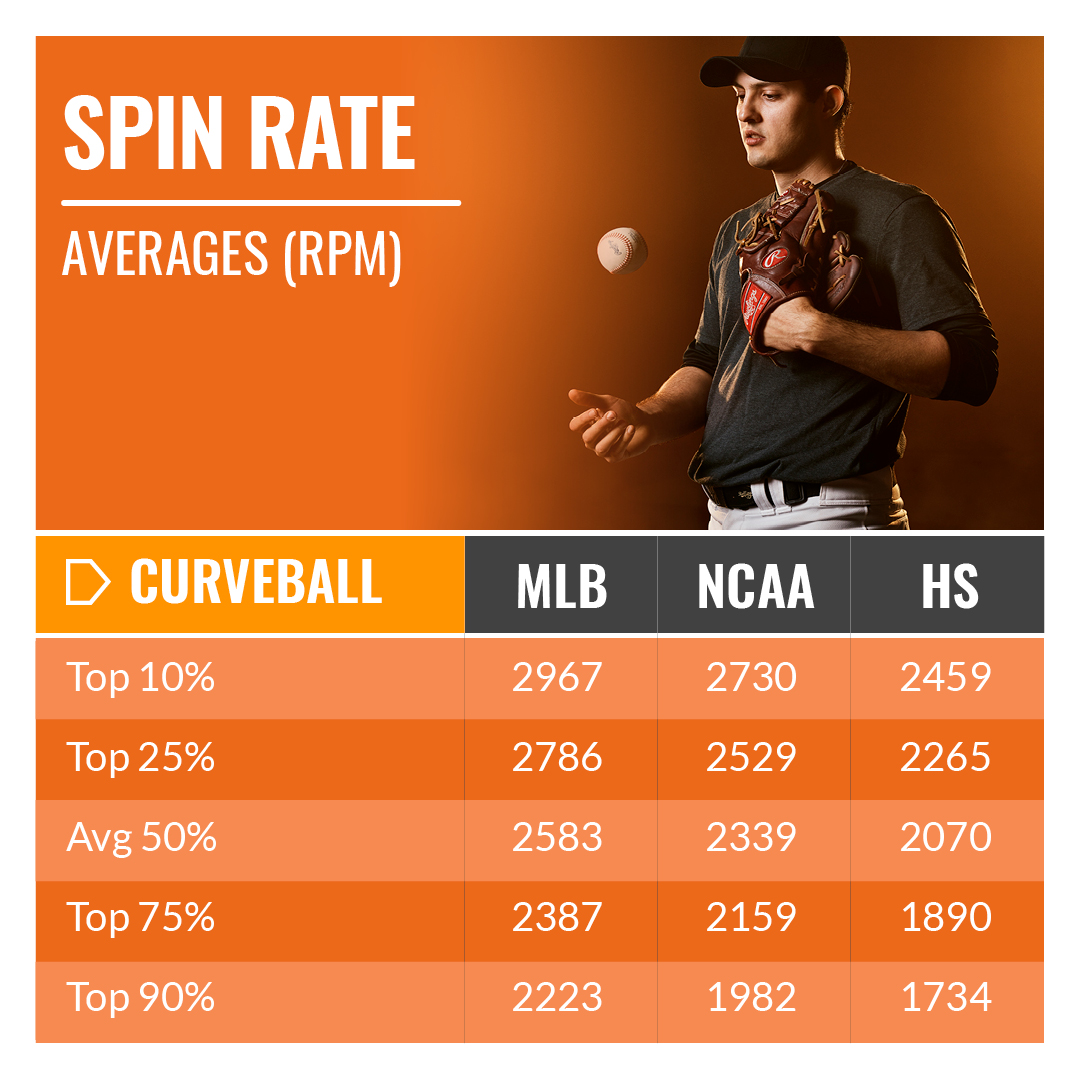
CURVEBALL SPIN RATE
Spin rate on curveballs is pretty simple: higher spin = nastier stuff. There are some ways to manipulate spin numbers slightly but for the most part spin is spin. At the moment, there are no well known ways to change your spin in a big way. Spin not only dictates how sharp your curveball is, but it can also aid in keeping hitters honest by having similar rotation matching that of your fastball.
Max Exit Velo
| Rank | Name | State | School | Class | Pos | Exit Velocity (max) |
| 1 | Tyler Stephens | TN | Columbia Academy | 2022 | 1B | 96.5 mph |
| 2 | Cooper Derryberry | TN | Brentwood Academy | 2022 | 3B | 95.8 mph |
| 3 | Ripken Clenny | TN | Scott Hill | 2023 | 3B | 93.4 mph |
| 4 | Josyah Farner | TN | McMinn Central | 2022 | OF | 93.4 mph |
| 5 | Donovan Peebles | TN | Smyrna | 2023 | 1B | 93.0 mph |
| 6 | Tripp Ray | TN | Briarcrest | 2024 | C | 92.3 mph |
| 7 | Zateece Kennedy | KY | Frederick Douglas | 2021 | OF | 91.8 mph |
| 8 | Walker Craig | TN | Cascade | 2024 | 1B | 91.7 mph |
| 9 | Griffin Orr | TN | Trinity Christian | 2021 | LHP | 91.7 mph |
| 10 | Jack Pitts | TN | Arlington | 2024 | C | 90.9 mph |
| 11 | Hunter McLerran | TN | Knights Academy | 2023 | 3B | 90.7 mph |
| 12 | Lantz Shirk | TN | Rossview | 2023 | RHP | 90.6 mph |
| 13 | Connor Gannon | TN | Lebanon | 2023 | 1B | 90.5 mph |
| 14 | Conrad Hanna | TN | Grace Christian | 2023 | 1B | 90.5 mph |
| 15 | Kade Shultz | TN | Lawrence County | 2023 | SS | 90.3 mph |
| 16 | PJ Mineo | TN | Battle Ground Academy | 2023 | OF | 90.2 mph |
| 17 | Carter Giles | TN | Signal Mountain | 2023 | 2B | 89.3 mph |
| 18 | William Baker | TN | McCallie | 2022 | 3B | 89.1 mph |
| 19 | Owen Brewer | TN | Grace Christian | 2024 | C | 88.4 mph |
| 20 | Parker Day | TN | Trousdale County | 2024 | RHP | 87.9 mph |
Average Exit Velo
| Rank | Name | State | School | Class | Pos | Exit Velocity (avg) |
| 1 | Tyler Stephens | TN | Columbia Academy | 2022 | 1B | 89.6 mph |
| 2 | Cooper Derryberry | TN | Brentwood Academy | 2022 | 3B | 88.4 mph |
| 3 | Tripp Ray | TN | Briarcrest | 2024 | C | 87.7 mph |
| 4 | Kade Shultz | TN | Lawrence County | 2023 | SS | 86.0 mph |
| 5 | Donovan Peebles | TN | Smyrna | 2023 | 1B | 85.2 mph |
| 6 | Ripken Clenny | TN | Scott Hill | 2023 | 3B | 84.9 mph |
| 7 | Griffin Orr | TN | Trinity Christian | 2021 | LHP | 83.2 mph |
| 8 | Jack Pitts | TN | Arlington | 2024 | C | 81.4 mph |
| 9 | Josyah Farner | TN | McMinn Central | 2022 | OF | 80.9 mph |
| 10 | Connor Gannon | TN | Lebanon | 2023 | 1B | 79.9 mph |
Max Distance
| Rank | Name | State | School | Class | Pos | Distance (max) |
| 1 | Tyler Stephens | TN | Columbia Academy | 2022 | 1B | 346 ft |
| 2 | Jack Pitts | TN | Arlington | 2024 | C | 338 ft |
| 3 | Ripken Clenny | TN | Scott Hill | 2023 | 3B | 337 ft |
| 4 | Cooper Derryberry | TN | Brentwood Academy | 2022 | 3B | 335 ft |
| 5 | Carter Giles | TN | Signal Mountain | 2023 | 2B | 333 ft |
| 6 | Donovan Peebles | TN | Smyrna | 2023 | 1B | 325 ft |
| 7 | Owen Brewer | TN | Grace Christian | 2024 | C | 318 ft |
| 8 | Aidan Linder | TN | Cookeville | 2023 | RHP | 318 ft |
| 9 | Josyah Farner | TN | McMinn Central | 2022 | OF | 317 ft |
| 10 | PJ Mineo | TN | Battle Ground Academy | 2023 | OF | 317 ft |
Average Distance
| Rank | Name | State | School | Class | Pos | Distance (avg) |
| 1 | Donovan Peebles | TN | Smyrna | 2023 | 1B | 266 ft |
| 2 | Jack Pitts | TN | Arlington | 2024 | C | 257 ft |
| 3 | Ripken Clenny | TN | Scott Hill | 2023 | 3B | 255 ft |
| 4 | Owen Brewer | TN | Grace Christian | 2024 | C | 253 ft |
| 5 | Griffin Orr | TN | Trinity Christian | 2021 | LHP | 252 ft |
| 6 | Tyler Stephens | TN | Columbia Academy | 2022 | 1B | 231 ft |
| 7 | Cooper Buckner | TN | Green Hill | 2024 | OF | 222 ft |
| 8 | Miller Cothron | TN | East Robertson | 2025 | C | 214 ft |
| 9 | Chase Wright | TN | Nashville Christian | 2022 | 2B | 213 ft |
| 10 | Josyah Farner | TN | McMinn Central | 2022 | OF | 210 ft |
Max Fastball Velo
| Rank | Name | State | School | Class | Pos | Velocity (max) |
| 1 | Parker Day | TN | Trousdale County | 2024 | RHP | 86.4 mph |
| 2 | Trent Miller | TN | Greenbrier | 2023 | RHP | 86.2 mph |
| 3 | William Baker | TN | McCallie | 2022 | 3B | 84.2 mph |
| 4 | Hunter McLerran | TN | Knights Academy | 2023 | 3B | 83.5 mph |
| 5 | Lantz Shirk | TN | Rossview | 2023 | RHP | 80.6 mph |
| 6 | Griffin Orr | TN | Trinity Christian | 2021 | LHP | 79.2 mph |
| 7 | Aidan Linder | TN | Cookeville | 2023 | RHP | 78.7 mph |
| 8 | Landon Parman | TN | Mt. Juliet | 2024 | LHP | 78.0 mph |
| 9 | Elijah Shreeve | TN | Lebanon | 2024 | RHP | 77.4 mph |
| 10 | Japhia Kennedy | KY | Frederick Douglas | 2022 | RHP | 77.2 mph |
Peak FB Spin Rate
| Rank | Name | State | School | Class | Pos | Spin Rate (max) |
| 1 | Parker Day | TN | Trousdale County | 2024 | RHP | 2424 rpm |
| 2 | Trent Miller | TN | Greenbrier | 2023 | RHP | 2285 rpm |
| 3 | Lantz Shirk | TN | Rossview | 2023 | RHP | 2282 rpm |
| 4 | Aidan Linder | TN | Cookeville | 2023 | RHP | 2186 rpm |
| 5 | Griffin Orr | TN | Trinity Christian | 2021 | LHP | 2134 rpm |
Average FB Spin Rate
| Rank | Name | State | School | Class | Pos | Spin Rate (avg) |
| 1 | Parker Day | TN | Trousdale County | 2024 | RHP | 2260 rpm |
| 2 | Trent Miller | TN | Greenbrier | 2023 | RHP | 2198 rpm |
| 3 | Lantz Shirk | TN | Rossview | 2023 | RHP | 2185 rpm |
| 4 | Aidan Linder | TN | Cookeville | 2023 | RHP | 2055 rpm |
| 5 | Griffin Orr | TN | Trinity Christian | 2021 | LHP | 2002 rpm |
Bauer Units
| Rank | Name | State | School | Class | Pos | Spin Score (max) |
| 1 | Parker Day | TN | Trousdale County | 2024 | RHP | 28 |
| 2 | Lantz Shirk | TN | Rossview | 2023 | RHP | 28 |
| 3 | Aidan Linder | TN | Cookeville | 2023 | RHP | 27 |
| 4 | Trent Miller | TN | Greenbrier | 2023 | RHP | 26 |
| 5 | Griffin Orr | TN | Trinity Christian | 2021 | LHP | 26 |
| 6 | Max Paranjape | TN | Brentwood | 2023 | OF | 26 |
| 7 | Walker Craig | TN | Cascade | 2024 | 1B | 26 |
| 8 | Zachary Faerber | TN | Clarksville | 2022 | LHP | 26 |
| 9 | Tyler Casserly | TN | Middle Tennessee Christian | 2024 | OF | 26 |
| 10 | Jacob Wendland | TN | Lipscomb Academy | 2024 | 3B | 25 |
FB Avg. Induced Vertical Break
| Rank | Name | State | School | Class | Pos | IVB (avg) |
| 1 | Zachary Faerber | TN | Clarksville | 2022 | LHP | 19.7 in |
| 2 | Griffin Orr | TN | Trinity Christian | 2021 | LHP | 18.5 in |
| 3 | Tyler Casserly | TN | Middle Tennessee Christian | 2024 | OF | 18.2 in |
| 4 | Japhia Kennedy | KY | Frederick Douglas | 2022 | RHP | 17.9 in |
| 5 | Trent Miller | TN | Greenbrier | 2023 | RHP | 16.4 in |
Breaking Ball Velo Ranges (CB & SL)
| Rank | Name | State | School | Class | Pos | Velo Range |
| 1 | Parker Day | TN | Trousdale County | 2024 | RHP | 75.1-78.7 mph |
| 2 | Trent Miller | TN | Greenbrier | 2023 | RHP | 71.6-72.9 mph |
| 3 | Hunter McLerran | TN | Knights Academy | 2023 | 3B | 68.8-72.3 mph |
| 4 | Aidan Linder | TN | Cookeville | 2023 | RHP | 67.8-71.7 mph |
| 5 | Griffin Orr | TN | Trinity Christian | 2021 | LHP | 69.1-70.1 mph |
| Rank | Name | State | School | Class | Pos | Velo Range |
| 1 | William Baker | TN | McCallie | 2022 | 3B | 71.7-77.1 mph |
Max Breaking Ball Spin Rate (CB & SL)
| Rank | Name | State | School | Class | Pos | Spin Rate (max) |
| 1 | Parker Day | TN | Trousdale County | 2024 | RHP | 2689 rpm |
| 2 | Lantz Shirk | TN | Rossview | 2023 | RHP | 2674 rpm |
| 3 | Trent Miller | TN | Greenbrier | 2023 | RHP | 2330 rpm |
| 4 | Jon Payne | TN | Summit | 2022 | RHP | 2161 rpm |
| 5 | Max Paranjape | TN | Brentwood | 2023 | OF | 2065 rpm |
| Rank | Name | State | School | Class | Pos | Spin Rate (max) |
| 1 | William Baker | TN | McCallie | 2022 | 3B | 2000 rpm |
Avg. Breaking Ball Spin Rate (CB & SL)
| Rank | Name | State | School | Class | Pos | Spin Rate (avg) |
| 1 | Parker Day | TN | Trousdale County | 2024 | RHP | 2626 rpm |
| 2 | Lantz Shirk | TN | Rossview | 2023 | RHP | 2610 rpm |
| 3 | Trent Miller | TN | Greenbrier | 2023 | RHP | 2216 rpm |
| 4 | Max Paranjape | TN | Brentwood | 2023 | OF | 2050 rpm |
| 5 | Aidan Linder | TN | Cookeville | 2023 | RHP | 2032 rpm |
| Rank | Name | State | School | Class | Pos | Spin Rate (avg) |
| 1 | William Baker | TN | McCallie | 2022 | 3B | 1951 |
Full TM Leaderboard
Check out our website for more information on prep baseball in the Volunteer State.
Click HERE to purchase a subscription which gives you access to additional information on the site, including 10,000+ Player Prospect Videos, State and National Rankings, Advanced Data Metrics and much more.
Click HERE to create a free profile.
More Content