The athlete's fastest 60-yard dash time in the given event year. Measured in seconds (s)
7.54
Infield Velocity
The athlete's maximum throwing velocity from an infield position in the given event year. Measured in miles per hour (MPH).
75.0
Power / Speed Score
A simple calculation that divides the athlete’s Exit Velocity Max by the athlete’s 60 Yard Dash time for the given event year. For example, 98 MPH / 7.00s = 14.00.
12.2
60 Yard Dash
The athlete's fastest 60-yard dash time in the given event year. Measured in seconds (s)
7.72
Infield Velocity
The athlete's maximum throwing velocity from an infield position in the given event year. Measured in miles per hour (MPH).
72.0
Power / Speed Score
A simple calculation that divides the athlete’s Exit Velocity Max by the athlete’s 60 Yard Dash time for the given event year. For example, 98 MPH / 7.00s = 14.00.
11.1
60 Yard Dash
The athlete's fastest 60-yard dash time in the given event year. Measured in seconds (s)
7.76
Infield Velocity
The athlete's maximum throwing velocity from an infield position in the given event year. Measured in miles per hour (MPH).
70.0
Power / Speed Score
A simple calculation that divides the athlete’s Exit Velocity Max by the athlete’s 60 Yard Dash time for the given event year. For example, 98 MPH / 7.00s = 14.00.
11.0
Infield Velocity
The athlete's maximum throwing velocity from an infield position in the given event year. Measured in miles per hour (MPH).
The highest Edge Score within the given year. Edge Score is a comprehensive score that takes the core-six visual skills into account, providing an assessment of an athlete’s overall visual ability.
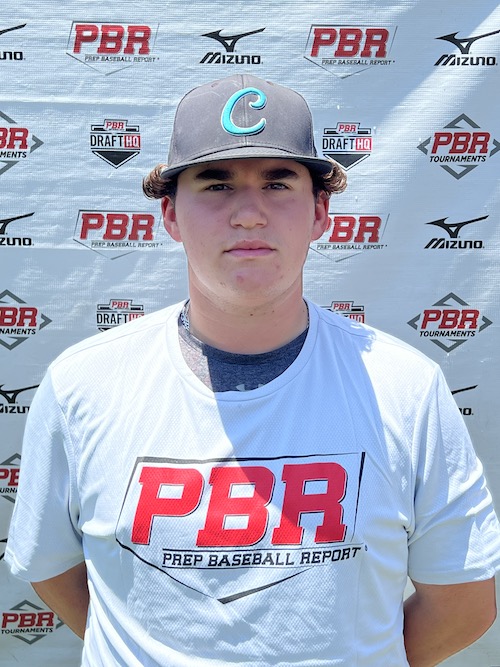
6-foot, 200-pound solid sturdy frame. Solid confident at the plate, Barbosa had a max exit velocity of 85 mph. (61.2 mph bat speed average). (20.6 mph hand speed average). Starts in a strong open stance with an active controlled load, then uses a leg kick. Bat speed is developing raw, displays a flat upward swing plane and high balanced finish. He created loud contact and found some barrels. Aggressive approach. Solid capable while in the infield, made throws up to 70 mph; had sure hands, consistent footwork, and a clean exchange. Movements laterally were average and he fields the ball out front. Consistent accuracy to the bases, used a longer arm action with a high ¾ slot. Recorded a time of 7.76 in the 60-yard dash.
Draft Reports
Contact
Premium Content Area
To unlock contact information, you need to purchase a ScoutPLUS subscription.


 Sign in to view rankings
VA/MD State Games
6-foot, 200-pound solid sturdy frame. Solid confident at the plate, Barbosa had a max exit velocity of 85 mph. (61.2 mph bat speed average). (20.6 mph hand speed average). Starts in a strong open stance with an active controlled load, then uses a leg kick. Bat speed is developing raw, displays a flat upward swing plane and high balanced finish. He created loud contact and found some barrels. Aggressive approach. Solid capable while in the infield, made throws up to 70 mph; had sure hands, consistent footwork, and a clean exchange. Movements laterally were average and he fields the ball out front. Consistent accuracy to the bases, used a longer arm action with a high ¾ slot. Recorded a time of 7.76 in the 60-yard dash.