Prep Baseball Report

Player to Watch: '22 Luke Metzker


Brett Harrison
Nevada Scouting Director

We will begin looking at some of the rising prospects in the 2022 Class that have made significant jumps in recent months and project to continue making positive progression over the next couple of years. The up and coming classes have a wealth of talent that will bring an abundance of attention to our state as a place to find talented prospects. 

A standout at the Northern Nevada Scout Day, Metzker is a rising, two-way prospect has clean actions throughout his game and could make big leaps in the coming year. With his current stature at 5-foot-11, 145 pounds, he sat low 80's earlier this year with a raw, but clean delivery that projects to add significant velocity as he continues to add strength and size to his lean frame. The continued physical development should also translate to an increase in power at the plate (currently has a 77 mph Exit Velocity) as well. In the field, he displays promising actions through the ball that should allow him to stay up the middle throughout his prep career and at the next level. 
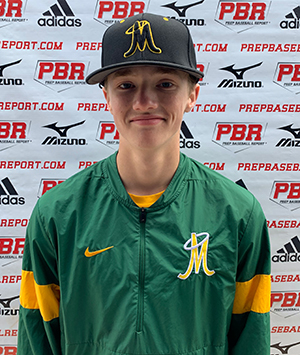
Luke Metzker

Class of 2022 / RHP

Player Information

  • Graduating Class: 2022
  • Primary Position: RHP
    Secondary Position: SS
  • High School: Bishop Manogue
    State: NV
  • Summer Team: Reno Athletics
  • Height: 6-0
    Weight: 170lbs
  • Bat/Throw: R/R

Statistics

Pitching
88
Max FB
(02/27/21)
84 - 87
FB
(02/27/21)
68 - 71
CB
(02/16/20)
70 - 79
CH
(08/29/20)
Pitching
Max FB
88
FB
84 - 87
CB
67 - 70
CH
72 - 75
Pitching
Max FB
85
FB
80 - 85
CB
62 - 67
CH
70 - 79
Pitching
Max FB
84
FB
83 - 84
CB
65 - 67
CH
71 - 73
Pitching
Max FB
82
FB
81 - 82
CB
68 - 71
CH
70 - 72
Pitching
Max FB
79
FB
75 - 79
CB
63 - 65
Position
6.86
60-yard
(08/21/21)
90
INF Velo
(02/27/21)
90
Exit Velo
(08/29/20)
Position
60-yard
7.33
INF Velo
85
Position
60-yard
7.27
INF Velo
90
Exit Velo
82
Position
60-yard
7.36
INF Velo
85
Exit Velo
90
Position
60-yard
7.6
INF Velo
82
Exit Velo
78
Position
60-yard
7.6
INF Velo
82
Exit Velo
78
Position
60-yard
7.63
INF Velo
80
Exit Velo
77
Position
60-yard
7.68
INF Velo
67
Exit Velo
74
Trackman - Fastball
87.2
Velocity (max)
(08/12/21)
83.7 - 86.5
Velo Range
(08/21/21)
82.6
Eff Velocity (avg)
(08/21/21)
2523
Spin Rate (max)
(08/21/21)
2435
Spin Rate (avg)
(08/21/21)
IVB (max)
(08/29/20)
IVB (avg)
(08/12/21)
HM (max)
(08/29/20)
HM (avg)
(08/29/20)
Extension (avg)
(08/12/21)
Release Ht (avg)
(08/21/21)
Spin Score (max)
(08/21/21)
Zone %
(08/12/21)
Trackman - Fastball
Velocity (max)
86.9
Velo Range
83.7 - 86.5
Eff Velocity (avg)
82.6
Spin Rate (max)
2523
Spin Rate (avg)
2435
IVB (max)
IVB (avg)
HM (max)
HM (avg)
Extension (avg)
Release Ht (avg)
Spin Score (max)
Zone %
Trackman - Fastball
Velocity (max)
87.2
Velo Range
81.1 - 85.5
Eff Velocity (avg)
81.6
Spin Rate (max)
2437
Spin Rate (avg)
2299
IVB (max)
IVB (avg)
HM (max)
HM (avg)
Extension (avg)
Release Ht (avg)
Spin Score (max)
Zone %
Trackman - Fastball
Velocity (max)
85.4
Velo Range
80.5 - 85.1
Eff Velocity (avg)
80.2
Spin Rate (max)
2347
Spin Rate (avg)
2233
IVB (max)
IVB (avg)
HM (max)
HM (avg)
Extension (avg)
Release Ht (avg)
Spin Score (max)
Zone %
Trackman - Curveball
72.6
Velocity (max)
(08/21/21)
68.6 - 72.3
Velo Range
(08/21/21)
67.6
Eff Velocity (avg)
(08/21/21)
2567
Spin Rate (max)
(08/21/21)
2514
Spin Rate (avg)
(08/21/21)
IVB (max)
(08/21/21)
IVB (avg)
(08/21/21)
HM (max)
(08/21/21)
HM (avg)
(08/21/21)
Extension (avg)
(08/12/21)
Release Ht (avg)
(08/12/21)
Spin Score (max)
(08/29/20)
Zone %
(08/21/21)
Trackman - Curveball
Velocity (max)
72.6
Velo Range
68.6 - 72.3
Eff Velocity (avg)
67.6
Spin Rate (max)
2567
Spin Rate (avg)
2514
IVB (max)
IVB (avg)
HM (max)
HM (avg)
Extension (avg)
Release Ht (avg)
Spin Score (max)
Zone %
Trackman - Curveball
Velocity (max)
72.2
Velo Range
67.1 - 70.1
Eff Velocity (avg)
66.3
Spin Rate (max)
2525
Spin Rate (avg)
2462
IVB (max)
IVB (avg)
HM (max)
HM (avg)
Extension (avg)
Release Ht (avg)
Spin Score (max)
Zone %
Trackman - Curveball
Velocity (max)
66.7
Velo Range
63.2 - 66.1
Eff Velocity (avg)
61.8
Spin Rate (max)
2437
Spin Rate (avg)
2341
IVB (max)
IVB (avg)
HM (max)
HM (avg)
Extension (avg)
Release Ht (avg)
Spin Score (max)
Zone %
Trackman - ChangeUp
78.8
Velocity (max)
(08/29/20)
70.6 - 75.4
Velo Range
(08/29/20)
71.3
Eff Velocity (avg)
(08/12/21)
2143
Spin Rate (max)
(08/29/20)
1891
Spin Rate (avg)
(08/29/20)
IVB (max)
(08/29/20)
IVB (avg)
(08/12/21)
HM (max)
(08/29/20)
HM (avg)
(08/12/21)
Extension (avg)
(08/12/21)
Release Ht (avg)
(08/21/21)
Spin Score (max)
(08/29/20)
Zone %
(08/29/20)
Trackman - ChangeUp
Velocity (max)
73.7
Velo Range
70.3 - 73.6
Eff Velocity (avg)
69.3
Spin Rate (max)
1903
Spin Rate (avg)
1821
IVB (max)
IVB (avg)
HM (max)
HM (avg)
Extension (avg)
Release Ht (avg)
Spin Score (max)
Zone %
Trackman - ChangeUp
Velocity (max)
72.8
Eff Velocity (avg)
71.3
Spin Rate (max)
1805
Spin Rate (avg)
1805
IVB (max)
IVB (avg)
HM (max)
HM (avg)
Extension (avg)
Release Ht (avg)
Spin Score (max)
Trackman - ChangeUp
Velocity (max)
78.8
Velo Range
70.6 - 75.4
Eff Velocity (avg)
70.3
Spin Rate (max)
2143
Spin Rate (avg)
1891
IVB (max)
IVB (avg)
HM (max)
HM (avg)
Extension (avg)
Release Ht (avg)
Spin Score (max)
Zone %
Trackman - Hitting
93.8
Exit Velocity (max)
(08/21/21)
88.1
Exit Velocity (avg)
(08/12/21)
248
Distance (avg)
(08/01/20)
323
Distance (max)
(08/21/21)
Hard Hit %
(08/12/21)
Sweet Spot %
(08/29/20)
Line Drive %
(08/12/21)
Fly Ball %
(08/01/20)
Ground Ball %
(08/29/20)
Trackman - Hitting
Exit Velocity (max)
93.8
Exit Velocity (avg)
84
Distance (avg)
209
Distance (max)
323
Hard Hit %
Sweet Spot %
Line Drive %
Fly Ball %
Ground Ball %
Trackman - Hitting
Exit Velocity (max)
92.6
Exit Velocity (avg)
88.1
Distance (avg)
198
Distance (max)
298
Hard Hit %
Sweet Spot %
Line Drive %
Fly Ball %
Ground Ball %
Trackman - Hitting
Exit Velocity (max)
89.6
Exit Velocity (avg)
81.6
Distance (avg)
174
Distance (max)
314
Sweet Spot %
Line Drive %
Fly Ball %
Ground Ball %
Trackman - Hitting
Exit Velocity (max)
87.7
Exit Velocity (avg)
77.8
Distance (avg)
248
Distance (max)
316
Sweet Spot %
Line Drive %
Fly Ball %
Ground Ball %
Blast - Hitting
25.0
Hand Speed (max)
(08/12/21)
24.2
Hand Speed (avg)
(08/12/21)
69.5
Bat Speed (max)
(08/21/21)
68.0
Bat Speed (avg)
(08/21/21)
Rot. Acc (max)
(08/01/20)
Rot. Acc (avg)
(08/01/20)
On Plane Eff (avg)
(08/01/20)
MaxOnPlaneEfficiency
(08/29/20)
Blast - Hitting
Hand Speed (max)
23.2
Hand Speed (avg)
22.7
Bat Speed (max)
69.5
Bat Speed (avg)
68
Rot. Acc (max)
Rot. Acc (avg)
On Plane Eff (avg)
Blast - Hitting
Hand Speed (max)
25
Hand Speed (avg)
24.2
Bat Speed (max)
65.3
Bat Speed (avg)
62.4
Rot. Acc (max)
Rot. Acc (avg)
On Plane Eff (avg)
MaxOnPlaneEfficiency
Blast - Hitting
Hand Speed (max)
22.6
Hand Speed (avg)
21.7
Bat Speed (max)
67.1
Bat Speed (avg)
64.4
Rot. Acc (max)
Rot. Acc (avg)
On Plane Eff (avg)
MaxOnPlaneEfficiency
Blast - Hitting
Hand Speed (max)
24.4
Hand Speed (avg)
22.9
Bat Speed (max)
67.8
Bat Speed (avg)
65.9
Rot. Acc (max)
Rot. Acc (avg)
On Plane Eff (avg)

Pitch_Scores

Pitch Scores - Fastball
Hop+
(08/12/21)
Rise+
(08/12/21)
Sink+
(08/12/21)
Pitch Scores - Fastball
Hop+
Rise+
Sink+
Pitch Scores - Curveball
Hammer+
(08/12/21)
Sweep+
(08/12/21)
Pitch Scores - Curveball
Hammer+
Sweep+

--

UPPERCLASS TOP PROSPECT GAMES

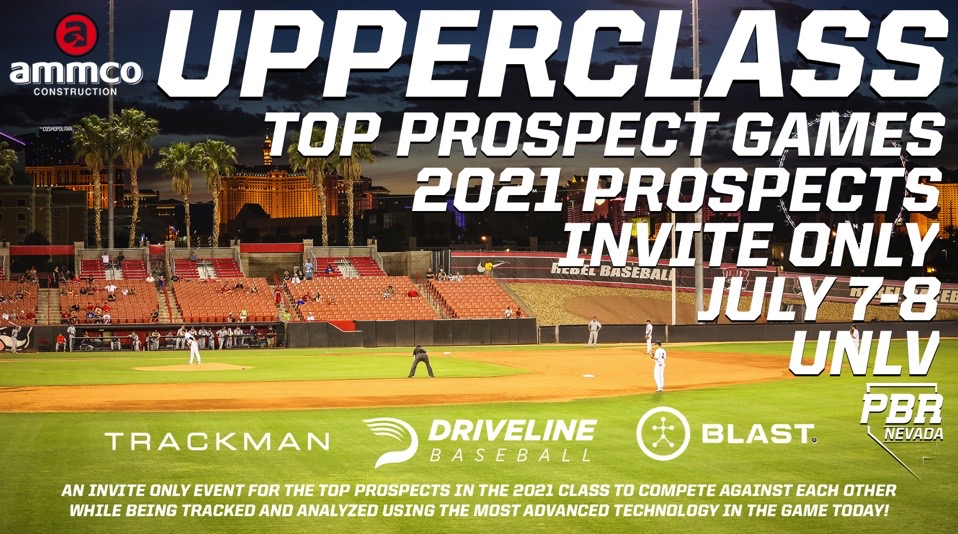
An INVITE ONLY event featuring top 2021 prospects from around the state. The event will take place on Tuesday, July 7 - Wednesday, July 8 at UNLV Players will participate in a pro-style workout, followed by simulated game-play. 

The event is limited in the number of participants.  Pitchers will be evaluated/videoed during live game action. Rosters will be organized/built by specific positions to maximize playing time/exposure for each player. If you want to take advantage of this opportunity, please get your registration in as soon as possible, as roster spots are limited, both by total quantity and by position.

Scouting, Technology and Data Analysis In One Event

Since 2005, Prep Baseball Report’s mission has been to provide the most credible scouting and event platform to help players and recruiters alike. As baseball has evolved, so have we. 

Prep Baseball Report has recently partnered with global leaders in the baseball technology and analysis space to deliver an unparalleled in-event and post-event experience. Now, at events across the country, players will receive actionable data from their event performance,  captured by industry-leading technologies, so they can elevate their game and get to the next level. Players will now receive actionable, post-event data from our industry-leading partners, including: TrackMan, Blast Motion and Driveline.