Trackman Hitting Leaders: Carolina Prospects - Hitters
June 15, 2023
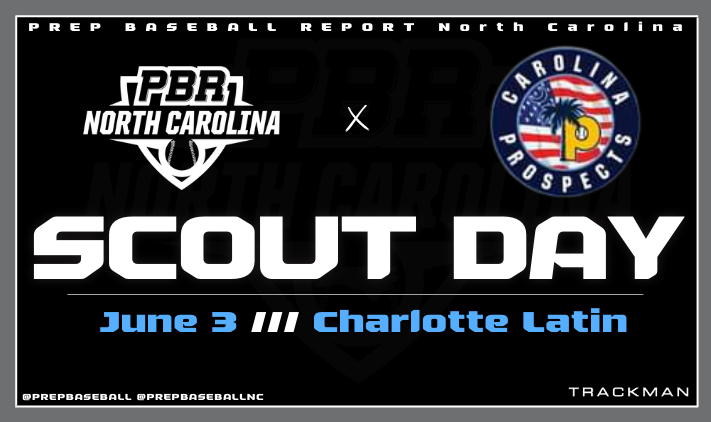
On Saturday June 3rd PBR or North Carolina was on hand at Charlotte Latin for a Scout Day with the On Deck O’s, NCBA Golden Spikes and Carolina Prospects. The Scout Day featured players from the 2024-2026 Grad Classes.
The day began with players going through a rotation that involved running a laser timed 60 and taking batting practice on the field with Trackman collecting ball flight data. After batting practice, position players went through a defensive evaluation. The scout day concluded with pitchers throwing a controlled bullpen with Trackman gathering information on each pitch.
Below we begin our breakdown of the players in attendance. Look for more information to follow in the coming days.
Click Here for full roster and stats
Trackman Hitting Leaders
PEAK EXIT VELOCITY
TrackMan is able to track every ball hit into fair territory, throughout the BP sessions. Below are the exit velocities produced by individual players.
| Rank | Name | State | School | Class | Pos | Exit Velocity (max) |
| 1 | Thomas Tyler | SC | Summerville | 2025 | OF | 87.6 mph |
| 2 | Reid Whitmore | SC | Wren | 2024 | LHP | 84.4 mph |
| 3 | Ryan Richardson | SC | Berkeley | 2025 | OF | 83.3 mph |
| 4 | Dylan Jimenez | SC | Hanahan High | 2025 | C | 82.0 mph |
| 5 | Jack Reilly | SC | Oceanside Collegiate | 2026 | C | 77.1 mph |
| 6 | Michael Mapes | SC | Lucy Beckham | 2025 | RHP | 76.4 mph |
| 7 | Andrew Grimm | SC | Cane Bay | 2025 | C | 72.5 mph |
AVERAGE EXIT VELOCITY
The average exit velocity measures a players ability to consistently produce hard contact. The average was taken based on every ball tracked by TrackMan throughout the player's BP session.
| Rank | Name | State | School | Class | Pos | Exit Velocity (avg) |
| 1 | CJ Myers | SC | Cane Bay | 2024 | RHP | 89.0 mph |
| 2 | Maxwell Nelms | SC | Bishop England | 2026 | OF | 84.0 mph |
| 3 | Reid Whitmore | SC | Wren | 2024 | LHP | 79.8 mph |
| 4 | Ryan Richardson | SC | Berkeley | 2025 | OF | 78.8 mph |
| 5 | Thomas Tyler | SC | Summerville | 2025 | OF | 75.1 mph |
| 6 | Michael Mapes | SC | Lucy Beckham | 2025 | RHP | 74.1 mph |
| 7 | Jack Reilly | SC | Oceanside Collegiate | 2026 | C | 70.9 mph |
| 8 | Dylan Jimenez | SC | Hanahan High | 2025 | C | 70.3 mph |
| 9 | Andrew Grimm | SC | Cane Bay | 2025 | C | 68.1 mph |
PEAK DISTANCE
| Rank | Name | State | School | Class | Pos | Distance (max) |
| 1 | CJ Myers | SC | Cane Bay | 2024 | RHP | 349 ft |
| 2 | Reid Whitmore | SC | Wren | 2024 | LHP | 304 ft |
| 3 | Dylan Jimenez | SC | Hanahan High | 2025 | C | 291 ft |
| 4 | Ryan Richardson | SC | Berkeley | 2025 | OF | 283 ft |
| 5 | Maxwell Nelms | SC | Bishop England | 2026 | OF | 276 ft |
| 6 | Michael Mapes | SC | Lucy Beckham | 2025 | RHP | 266 ft |
| 7 | Andrew Grimm | SC | Cane Bay | 2025 | C | 253 ft |
| 8 | Jack Reilly | SC | Oceanside Collegiate | 2026 | C | 252 ft |
| 9 | Thomas Tyler | SC | Summerville | 2025 | OF | 205 ft |
AVERAGE DISTANCE
| Rank | Name | State | School | Class | Pos | Distance (avg) |
| 1 | Reid Whitmore | SC | Wren | 2024 | LHP | 234 ft |
| 2 | CJ Myers | SC | Cane Bay | 2024 | RHP | 226 ft |
| 3 | Michael Mapes | SC | Lucy Beckham | 2025 | RHP | 223 ft |
| 4 | Andrew Grimm | SC | Cane Bay | 2025 | C | 194 ft |
| 5 | Ryan Richardson | SC | Berkeley | 2025 | OF | 174 ft |
| 6 | Jack Reilly | SC | Oceanside Collegiate | 2026 | C | 128 ft |
| 7 | Dylan Jimenez | SC | Hanahan High | 2025 | C | 118 ft |
| 8 | Thomas Tyler | SC | Summerville | 2025 | OF | 113 ft |
| 9 | Maxwell Nelms | SC | Bishop England | 2026 | OF | 93 ft |
HARD HIT PERCENTAGE
TrackMan is able to track and follow exit velocities of each hitter. Based on the individual's top exit velocity, TrackMan is able to give us a percentage of hard hit balls. This percentage is based off of each individual hitter's top exit velocity.
| Rank | Name | State | School | Class | Pos | Hard Hit % |
| 1 | CJ Myers | SC | Cane Bay | 2024 | RHP | 37 % |
| 2 | Maxwell Nelms | SC | Bishop England | 2026 | OF | 30 % |
LAUNCH ANGLE PERCENTAGE
Based on the ball flight, TrackMan is able to identify each hit as a ground ball, line drive, or fly ball. While there are many factors as to why a hitter may approach each pitch in a certain way, the overall groupings of BP can give some insight to each hitter's approach.
Line Drive %
| Rank | Name | State | School | Class | Pos | Line Drive % |
| 1 | Michael Mapes | SC | Lucy Beckham | 2025 | RHP | 60 % |
| 2 | Ryan Richardson | SC | Berkeley | 2025 | OF | 57 % |
| 3 | Thomas Tyler | SC | Summerville | 2025 | OF | 42 % |
| 4 | CJ Myers | SC | Cane Bay | 2024 | RHP | 37 % |
| 5 | Reid Whitmore | SC | Wren | 2024 | LHP | 33 % |
| 6 | Jack Reilly | SC | Oceanside Collegiate | 2026 | C | 16 % |
| 7 | Maxwell Nelms | SC | Bishop England | 2026 | OF | 15 % |
| 8 | Dylan Jimenez | SC | Hanahan High | 2025 | C | 14 % |
Ground Ball %
| Rank | Name | State | School | Class | Pos | Ground Ball % |
| 1 | Dylan Jimenez | SC | Hanahan High | 2025 | C | 57 % |
| 2 | Maxwell Nelms | SC | Bishop England | 2026 | OF | 53 % |
| 3 | Jack Reilly | SC | Oceanside Collegiate | 2026 | C | 50 % |
| 4 | Thomas Tyler | SC | Summerville | 2025 | OF | 42 % |
| 5 | Reid Whitmore | SC | Wren | 2024 | LHP | 33 % |
| 6 | Ryan Richardson | SC | Berkeley | 2025 | OF | 28 % |
| 7 | CJ Myers | SC | Cane Bay | 2024 | RHP | 25 % |
| ^ | Andrew Grimm | SC | Cane Bay | 2025 | C | 25 % |
Fly Ball %
| Rank | Name | State | School | Class | Pos | Fly Ball % |
| 1 | Andrew Grimm | SC | Cane Bay | 2025 | C | 75.0 % |
| 2 | Michael Mapes | SC | Lucy Beckham | 2025 | RHP | 40.0 % |
| 3 | CJ Myers | SC | Cane Bay | 2024 | RHP | 37.5 % |
| 4 | Reid Whitmore | SC | Wren | 2024 | LHP | 33.3 % |
| 5 | Maxwell Nelms | SC | Bishop England | 2026 | OF | 30.8 % |
| 6 | Dylan Jimenez | SC | Hanahan High | 2025 | C | 28.6 % |
| 7 | Jack Reilly | SC | Oceanside Collegiate | 2026 | C | 16.7 % |
| 8 | Ryan Richardson | SC | Berkeley | 2025 | OF | 14.3 % |