Finding the relationship between Grip Strength and Hitting
March 28, 2024
At Prep Baseball baseball showcases, we’re constantly looking for new ways to evaluate players with the data we’ve collected and the technology incorporated into our events. In this, the first edition of our ‘Tech Ed’ series, we’re sharing our insight into the application of grip strength testing for players, now that we’ve been conducting these tests at the majority of our events, like the 2023 Future Games, for nearly a year now.
While there’s some published work available on the internet regarding the relationship between baseball skills and grip strength, we wanted to take the data we had been collecting for the past nine months or so to discover if there were any strong correlations between grip strength and baseball tools that might not be so obvious.
Naturally, we found a strong correlation between high grip strength and high exit velocity rates, but that’s fairly straightforward we think, so we dug a little deeper to help players better understand how to interpret their grip strength measurements collected at Prep Baseball showcases.
ABOUT THE TEST
Firstly, we currently take all position players through grip strength testing at our events, while the pitchers-only aren’t required to participate in the testing, at least not yet.
For the test itself, players are handed an instrument called a dynamometer, a handheld device that measures grip force in pounds. During the test, players are asked to hold the dynamometer in hand at their side in a relaxed position, raise it to a 90 degree angle, then squeeze it from there as hard as they can for a moment – and without shaking the device too much while their arm remains in that same position. The player switches hands and repeats the test while our team records those scores so that the measurements can eventually live inside each player’s Prep Baseball profile.
HERE'S THE HIGHLIGHTS
In the sections below, we’re about to get real technical about how we arrived at our conclusions, but we thought it’d be helpful to lay them out more simply in this section. You’re welcome to read on and learn about the intricacies of our research and experiments, but otherwise, we’ve pulled out the need-to-know info here (data from Prep Baseball events between May 21, 2023 to March 9, 2024):
- About half of the max grip measurements of all the players we tested at our showcases over the last year fell between 106 and 132 pounds.
- The median max grip strength measurement of the 14-year-old players tested was 109.6 pounds; for 17-year olds, it was 129.3 pounds.
- For every 1% increase in the player’s percentage of difference in max grip strength values between their dominant and non-dominant hands, there was a 0.12% decrease in the percentage of balls hit 90 mph or above for that same player.
- A difference in the percentage of max grip strength scores in the dominant and non-dominant hand is ideally under 10%.
- Hitters who use their dominant hand (highest max grip strength) as their bottom hand on the bat tend to generate higher bat speed on average.
- 6,073 total players tested, 88% right-handed hitters vs. 11% left-handed hitters; lefties demonstrated more even scores between their max grips with either hand.
To all players: As an athlete, it is useful to learn max grip strength values from Prep Baseball events, especially because you’ll also be able to compare it to the quality of your batted-ball data measured by the TrackMan units recorded during the event’s batting practice. Combining grip strength measurements and the data collected by TrackMan can help assess some potential areas of development.
Increasing grip strength might not be the best tactic outright, especially if your grip strength is already measured at average or above and your max values in each hand are similar. But it’s also useful to know if a player shows an imbalance in max grip strength between each hand, and which hand is stronger, as it could be contributing to some inefficiencies in his swing that is causing you to make meaningful contact at a lower percentage than you’re capable of.
Instead, players should aim to increase their grip strength equally in both hands as much as possible while they limit the difference between them. Focusing solely on one hand will increase the difference between both hands, which seems like it may actually penalize hitting performance. It’s important to recognize the significance of grip strength, though it may be more purposefully utilized as a potential indicator of a breakdown in swing, rather than an area to target in the gym.
TARGET RANGES
Understandably, players generally don’t have much of a point of reference when it comes to their grip strength measurements upon receiving that information following the event. Our data team scraped the data we had access to on our website and generated the following table which better illustrates the range of results by age, on average, from the events that took place between May 2023 and March 2024: 
As you probably anticipated, grip strength naturally rises through age as players physically develop, but more importantly here are some averages players can target while they assess their own results.

The boxen plot above provides an overview of all values from athletes of all age ranges. As shown above, 50% of the results from high school athletes of all ages range between 106.4 pounds (25th percentile) and 132.4 pounds (75th percentile).
When broken down at an even more granular level, we see that there are certain positions that tend to yield higher grip strength averages, and those positions could be reasonably guessed, but here’s a look median grip strength measurements as it relates to both the player’s age and position on this heatmap:

We see here that first basemen tend to generate the highest grip force among players who perform the test at our events, followed up by the players who consider themselves as primary pitchers, and then primary third basemen. Again, these results could have likely been surmised without this experiment, but it’s useful for the player to know where their measurements fall on charts like this one before we start to dig into the data even further.
THE BREAKDOWN
MAX GRIP STRENGTH & HITTING
The focus path for the research was to explore the possible relationships between grip strength and the hitting performance of a player.
From the May 2023 to March 2024 date range that we’re pulling our data from, we have grip strength data for 6,073 players. Of that group, approximately 88% of them are right-handed hitters and 11% are left-handed hitters. Of all 6,000-plus players measured, 49.3% are considered right-hand dominant – meaning they recorded a higher grip strength value in their right hand, for the sake of this exercise. From there, 42.0% are considered left-hand dominant, and 8.7% recorded max grip strength values that were virtually equal.
We hypothesized that we’d see a much larger percentage of left-handed hitters would be classified as right-hand dominant (higher max grip strength in the right hand), considering there are many more left-handed hitters who are right-handed throwers than the reverse scenario. And previous research indicated that hitters with their grip-dominant hand placed at the bottom of the bat tended to generate more bat speed, making this group of favored left-handed-hitting/right-handed-throwing players an intriguing category of prospect based purely on profile.
This turned out to be true as, of the approximately 680 players in this group who are left-handed hitters, 306 of them are right-hand dominant, which is nearly 45% of the total, and another 59 of those hitters (8%) were categorized in the group of players with nearly equal max grip strength values in each hand. Just over 46% of that same group are considered left-hand dominant.
Comparatively, there were nearly 5,400 right-handed hitters included in our study, and just over 42% of them measured a higher max grip strength in their left hand, or the hand placed at the bottom of the bat. Almost exactly 50% of the right-handed hitters were also right-hand dominant.
Our hypothesis was mostly correct, though we anticipated seeing a larger percentage of left-handed hitters who are classified as right-hand dominant (45%), ultimately, as it compares to the right-handed hitters who are left-hand dominant (42%).
THE EXPERIMENT
With some of this categorization finished, we took it another step further to determine how large differences in each hand’s max grip value (greater than 10%) affects hitters. Does that imbalance show itself in the batted-ball events for these players in any discernible way?
Thus, with the aim of uncovering possible patterns related to hitting consistency, a multiple linear regression model was trained with a chosen response variable: (target) = % hits with exit velo >= 90 mph. The model was designed with this target as it not only accounts for the power of a single batted ball, but also for the hitting consistency of the player, which is critical for batters. Furthermore, because the purpose of the research is to understand if grip strength has an impact on hitting performance, the following grip strength-related features were leveraged:
- The player’s highest max grip strength measurement captured at the event, in either hand
- The percentage of difference between the player’s highest max grip value and the max grip strength value of their non-dominant hand
From this point, the following model was trained based on the aforementioned target and features:
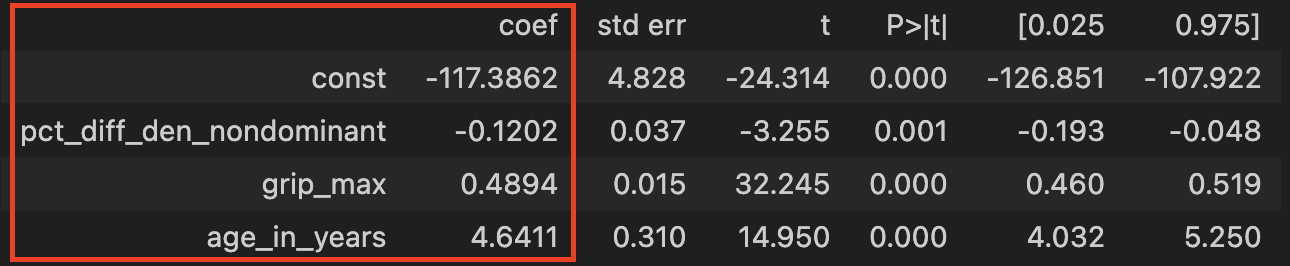
Using this, the regression equation could be written as follows:
% hits with exit velo >= 90 mph = (-117.39) + (-0.12 * pct_diff_den_nondominant) + (0.49 * grip_max) + (4.64 * age_in_years)
This model did help identify a way grip strength can be used in player development, as there appears to be a strong correlation between a high difference in max grip strength in a player’s non-dominant hand and a subsequent decrease in the frequency in which a player records an exit velocity at 90 mph or above.
Anecdotally, using the 2024 Super 60 as an example, three players struck 100% of their batted balls at 95 mph or above: Kale Fountain, Ryan Schwartz, and Matthew Conte. Each of their max grip strength values, and in both hands, were well-above-average, and none of the three had a percentage difference in their non-dominant hands that exceeded 9%.
Both Fountain and Schwartz were on the top-10 of max exit velocity leaderboard at the Super 60, while five others in the top-10 recorded a percentage difference in their non-dominant hands at or above 10%: Tyson Lewis (24%), Drew Dickerson (16%), Brendan Tunink (10%), Jimmy Janicki (16%), Jake Hanley (13%).
With this, while Fountain and Schwartz registered a hard-hit rate of 100%, Lewis, Janicki, and Hanley each recorded hard-hit rates below 90% – and Dickerson (70%) and Tunink (76%) were each below 80%. This is a very small sample size to be using, but it’s interesting to note here and it displays that there might be something to our experiment, and this might be an area for these players to optimize, as they’re clearly capable of generating one-of-a-kind bat strength, considering that they can find themselves near the top of an exit velo leaderboard like the one at the Super 60.
Example of interpreting the model coefficients: An increase of 1% to the percentage difference of a player’s non-dominant max grip value is associated with a 0.12% decrease in the percentage of that same player’s batted balls that are equal to or exceed an exit velocity of 90 mph (holding all other variables constant). With that, it is not a good idea to say that an increase of 1% in the percentage difference of a player’s non-dominant max grip value directly causes that decrease. This is because if there is any change in the features used to train the model, those coefficients will change, so without more statistical testing, we cannot guarantee that those are the best coefficients.
Related Content
- PBRPlus College's Historic Home Run Race: What'd these sluggers look like in high school? 4/22/24
- PBRPlus College Crosscheck, Week 8: LSU, Vanderbilt, Mizzou and Florida 4/15/24
- PBRPlus Prep Baseball JUCO Wire: Midseason Top-100 4/09/24
- PBRPlus 2024 MLB Draft: College's Midseason Risers 4/02/24
- PBRPlus DJ Svihlik joins Prep Baseball Draft HQ, adding 22 years of draft expertise 3/26/24