Maryland Most Viewed Profiles of 2022: No. 20
January 5, 2023
Follow @PBRMaryland
Facebook & Instagram
2022 continued to show how the recruiting world constantly changes and the ever increasing power and near necessity of player video on the internet. PBR Profiles are a great example on how players can have some control in their recruitment process and have that power to give instant access to any coach in the country with one simple click. Profile views continue to grow on our website as last year we had over 12 million views in 2021. In 2022, that number has increased even more with over 13 million views for the year.
Maryland Most Viewed Profiles of 2022
We go on with our Most Viewed Maryland Profiles of 2022 with our No. 20 spot.
Maryland Most Viewed Profiles No. 20
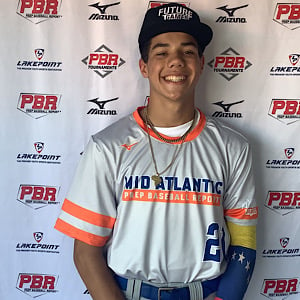
Miguel Leon
Class of 2026 / SS
Player Information
-
Graduating Class: 2026
-
Primary Position: SSSecondary Position: 2B
-
High School: JOHN CARROLL SCHOOLState: MD
- Summer Team: 2026 US Elite Mid Atlantic - Scout
-
Height: 5-11Weight: 170lbs
- Bat/Throw: R/R
Statistics
Pitching
74
Max FB
(07/26/22)
Position
6.91
60-yard
(08/13/23)
82
INF Velo
(02/19/23)
96
Exit Velo
(02/18/24)
3.91
H-1st
(02/18/24)
Power Speed Score
(08/13/23)

Trackman - Hitting
96.3
Exit Velocity (max)
(02/18/24)
89.3
Exit Velocity (avg)
(02/18/24)
223
Distance (avg)
(02/18/24)
358
Distance (max)
(02/18/24)
Hard Hit %
(02/18/24)
Sweet Spot %
(08/13/23)
Line Drive %
(02/18/24)
Fly Ball %
(08/27/22)
Ground Ball %
(02/19/23)
MD 2024 Preseason All-State Session II
Feb 18, 2024
Trackman - Hitting
Exit Velocity (max)
96.3
Exit Velocity (avg)
89.3
Distance (avg)
223
Distance (max)
358
Hard Hit %
Sweet Spot %
Line Drive %
Fly Ball %
Ground Ball %
Scout Day: US Elite Mid-Atlantic
Aug 27, 2023
Trackman - Hitting
Exit Velocity (max)
92.3
Exit Velocity (avg)
85.8
Distance (avg)
195
Distance (max)
319
Hard Hit %
Sweet Spot %
Line Drive %
Fly Ball %
Ground Ball %
2023 Mid-Atlantic Procase
Aug 13, 2023
Trackman - Hitting
Exit Velocity (max)
91.2
Exit Velocity (avg)
80.9
Distance (avg)
210
Distance (max)
334
Hard Hit %
Sweet Spot %
Line Drive %
Fly Ball %
Ground Ball %
2023 MD Preseason All-State Session II
Feb 19, 2023
Trackman - Hitting
Exit Velocity (max)
92
Exit Velocity (avg)
81.5
Distance (avg)
146
Distance (max)
296
Hard Hit %
Sweet Spot %
Line Drive %
Fly Ball %
Ground Ball %
Scout Day: US Elite Mid-Atlantic
Aug 27, 2022
Trackman - Hitting
Exit Velocity (max)
85.2
Exit Velocity (avg)
73.6
Distance (avg)
201
Distance (max)
304
Sweet Spot %
Line Drive %
Fly Ball %
Ground Ball %
PBR Junior Future Games
Jul 26, 2022
Trackman - Hitting
Exit Velocity (max)
87.4
Exit Velocity (avg)
80.1
Distance (avg)
185
Distance (max)
306
Sweet Spot %
Line Drive %
Fly Ball %
Ground Ball %

Blast - Hitting
22.8
Hand Speed (max)
(02/19/23)
21.8
Hand Speed (avg)
(02/19/23)
77.0
Bat Speed (max)
(02/18/24)
73.8
Bat Speed (avg)
(02/18/24)
Rot. Acc (max)
(02/18/24)
Rot. Acc (avg)
(08/27/22)
On Plane Eff (avg)
(07/26/22)
MaxOnPlaneEfficiency
(02/18/24)
MD 2024 Preseason All-State Session II
Feb 18, 2024
Blast - Hitting
Hand Speed (max)
22.4
Hand Speed (avg)
21
Bat Speed (max)
77
Bat Speed (avg)
73.8
Rot. Acc (max)
Rot. Acc (avg)
On Plane Eff (avg)
MaxOnPlaneEfficiency
2023 Mid-Atlantic Procase
Aug 13, 2023
Blast - Hitting
Hand Speed (max)
21.7
Hand Speed (avg)
21.2
Bat Speed (max)
70.9
Bat Speed (avg)
66.7
Rot. Acc (max)
Rot. Acc (avg)
On Plane Eff (avg)
MaxOnPlaneEfficiency
2023 MD Preseason All-State Session II
Feb 19, 2023
Blast - Hitting
Hand Speed (max)
22.8
Hand Speed (avg)
21.8
Bat Speed (max)
70.4
Bat Speed (avg)
66.1
Rot. Acc (max)
Rot. Acc (avg)
On Plane Eff (avg)
MaxOnPlaneEfficiency
Scout Day: US Elite Mid-Atlantic
Aug 27, 2022
Blast - Hitting
Hand Speed (max)
21.4
Hand Speed (avg)
20.5
Bat Speed (max)
69.6
Bat Speed (avg)
68.2
Rot. Acc (max)
Rot. Acc (avg)
On Plane Eff (avg)
MaxOnPlaneEfficiency
PBR Junior Future Games
Jul 26, 2022
Blast - Hitting
Hand Speed (max)
22.7
Hand Speed (avg)
21
Bat Speed (max)
73
Bat Speed (avg)
70.4
Rot. Acc (max)
Rot. Acc (avg)
On Plane Eff (avg)
MaxOnPlaneEfficiency
Vizual_Edge
Visual Skills
69.32
Edge Score
(02/18/24)
Swift
Swift
1.74
10-yd
(02/19/23)
3.91
30-yd
(08/13/23)
6.91
60-yd
(08/13/23)
20.5
Run speed (max)
(08/13/23)
8.3
Run Speed (avg)
(07/26/22)
1.49
RSi (max)
(07/26/22)
1.49
RSi (avg)
(07/26/22)
1384
Jump Power (max)
(07/26/22)
29.7
Jump Height (max)
(02/18/24)
28.6
Jump Height (avg)
(07/26/22)
PBR Junior Future Games
Jul 26, 2022
Swift
10-yd
1.78
30-yd
4.04
60-yd
7.19
Run speed (max)
19.5
Run Speed (avg)
8.3
RSi (max)
1.49
RSi (avg)
1.49
Jump Power (max)
1384
Jump Height (max)
28.6
Jump Height (avg)
28.6