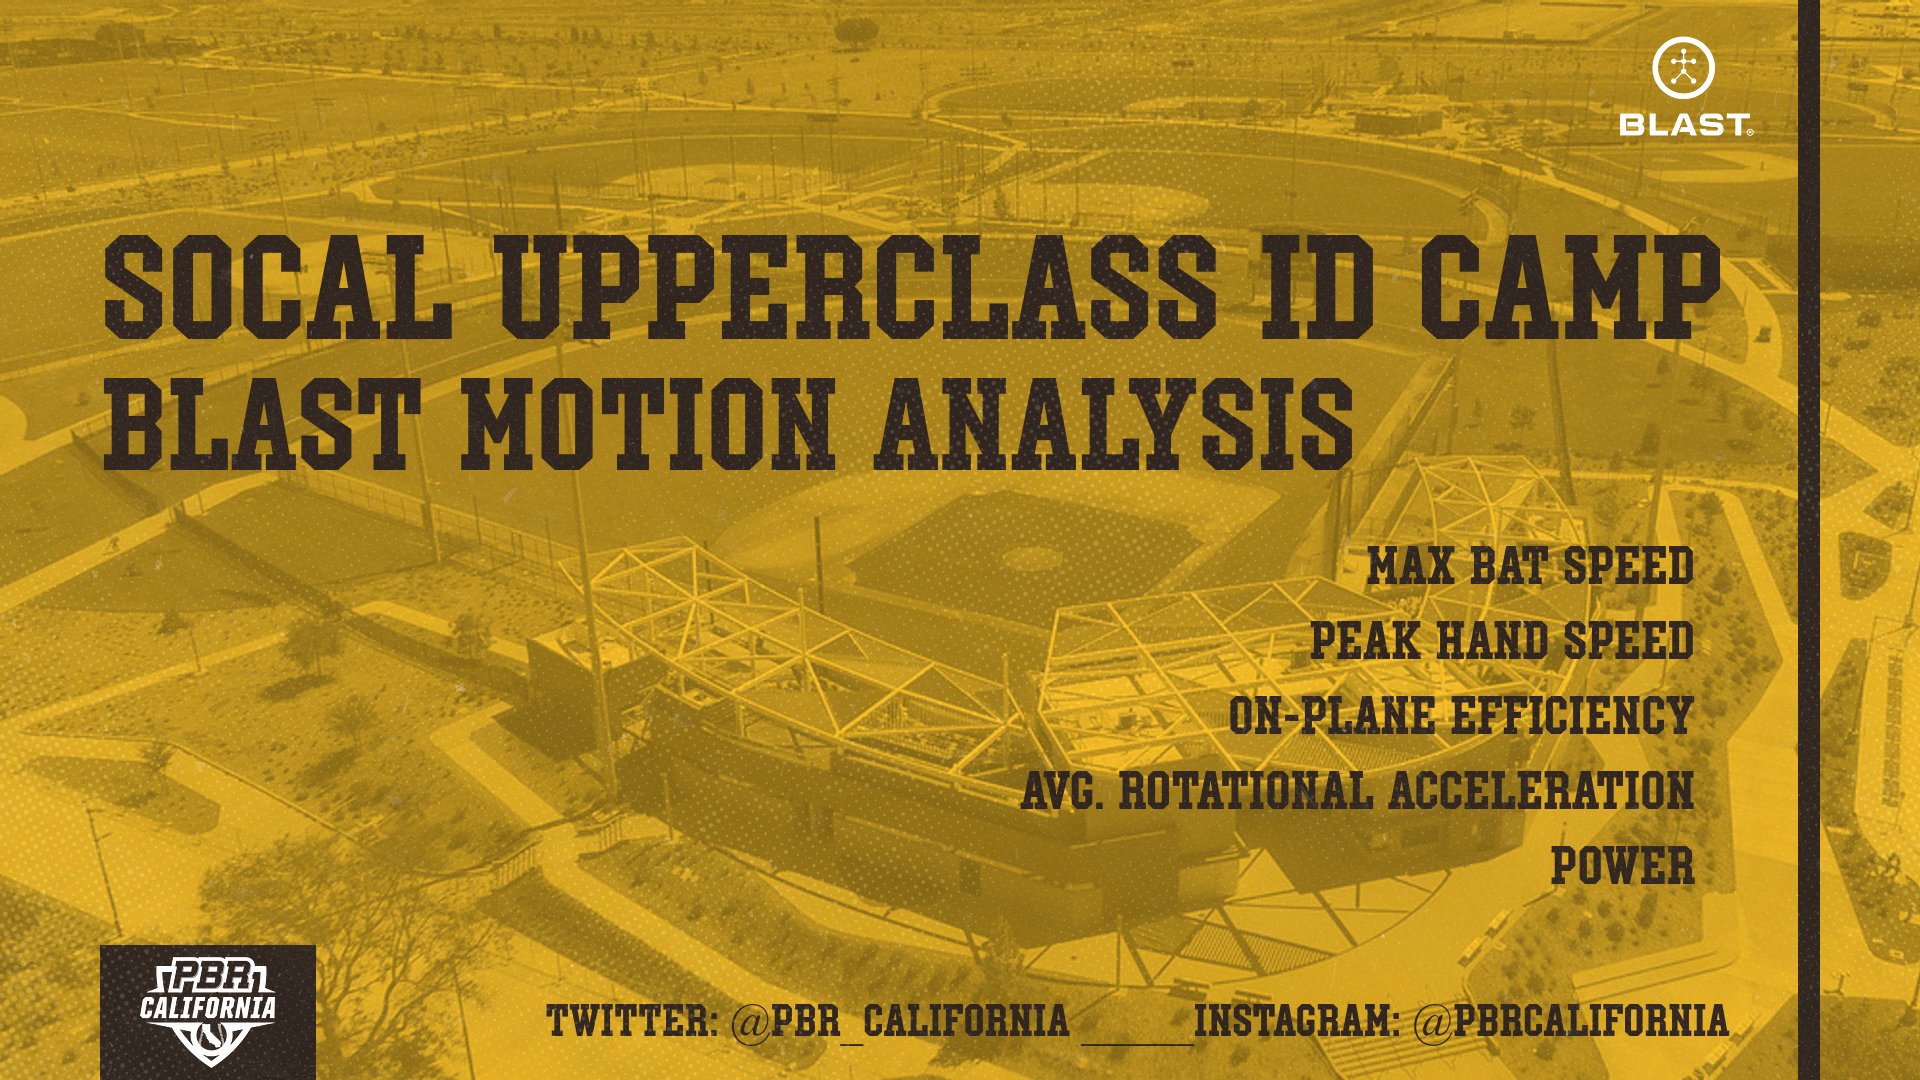
SoCal Upperclass ID: Blast Motion Analysis
November 5, 2020
Follow @PBRCaliforniaFollow @LesLukachFollow@Clemmens_PBRFollow @SteveDoherty643Follow @Jacked_23Follow @JoeyCohen20
New Episode LIVE now!-At The Yard Podcast
IRVINE, CALIF. - One of the important tools Prep Baseball Report has implemented at its events is the use of Blast Motion sensors. During batting practice, the Blast Motion sensors measure Swing and Impact Metrics across several categories. Swing metrics measure pre-impact mechanics centered around plane, connection, and rotation while impact metrics measure pre-impact performance outcomes based on ball contact.
At the recent SoCal Upperclass ID Camp players were set up with a Blast Motion sensor before each round of batting practice. With the Blast Motion sensor, we were able to collect data from each swing taken by each prospect at the event. The metrics collected include: Bat Speed, On Plane Efficiency, Peak Hand Speed, Power and Rotational Acceleration.
Each player has their Blast Motion metrics uploaded into their profiles following the completion of the event providing insight into areas that could be improved upon as well as helping paint a clear picture of the player to the college and professional scouts doing their research on prospects they may be interested in.
Many of the players in the upperclass event were uncommitted and many of them put up some very good numbers, below we illustrate the top 25 players in each category.
Category Leaders
Max Bat Speed: Julian Eskridge (Arcadia HS) - 82 mph
Peak Hand Speed: Sam Purgason (Truckee HS) - 26.09 mph
On-Plane Efficiency: Kaleb Duran (Summit HS), Joey Fonseca (El Diamante HS) - 87%
Avg. Rotational Acceleration: Anthony Beau Manuel (Gahr HS) - 37.6 g
Power: Bryce Gamble (El Dorado HS) - 5.24 kW
CATEGORICAL LEADERBOARDS
Bat Speed
Bat Speed is the observed speed of the sweet spot of the bat at impact. For more info: Blast Bat Speed
MLB Avg: 66-78 mph | MiLB: 63-75 mph | College: 66-75 mph
| Rank | Name | State | School | Class | Pos | Bat Speed (max) |
| 1 | Julian Eskridge | CA | Arcadia | 2021 | OF | 82.0 mph |
| 2 | Bryce Gamble | CA | El Dorado | 2021 | C | 80.1 mph |
| 3 | Corbin Ybarra | CA | IMG Academy | 2022 | OF | 79.6 mph |
| 4 | Cameron Shimokawa | CA | Diamond Ranch | 2021 | C | 79.3 mph |
| 5 | Morgan Strong | CA | Ramona | 2022 | C | 78.1 mph |
| 6 | Austin Overn | CA | Foothill | 2022 | OF | 77.9 mph |
| 7 | Noah Sharar | CA | Sage Creek | 2022 | C | 77.0 mph |
| 8 | Steve Arteaga | CA | Vista Murrieta | 2022 | C | 76.4 mph |
| 9 | Tyler Norgaard | CA | San Juan Hills | 2021 | 2B | 76.2 mph |
| ^ | Keone Takahashi | CA | Northgate | 2022 | RHP | 76.2 mph |
| 10 | Nico Brown | CA | Edison | 2022 | SS | 76.1 mph |
| 11 | Harrison Altschul | CA | Harvard Westlake | 2022 | OF | 76.0 mph |
| 12 | Paul Murrow | CA | Beckman | 2021 | OF | 75.7 mph |
| 13 | Jacob Mitchell | CA | Martin Luther King | 2022 | SS | 75.6 mph |
| 14 | Damien Delgadillo | CA | Ayala | 2021 | SS | 75.2 mph |
| ^ | Joaquin Sandoval | CA | San Marcos | 2022 | C | 75.2 mph |
| 15 | Ryan Chavez | CA | Yorba Linda | 2021 | 2B | 74.9 mph |
| 16 | Aiden Taurek | CA | Foothill | 2022 | OF | 74.8 mph |
| 17 | Barron Zamora | CA | Grossmont | 2022 | OF | 74.4 mph |
| 18 | Christopher Landaas | CA | San Juan Hills | 2021 | 1B | 74.1 mph |
| 19 | Sam Purgason | CA | Truckee | 2022 | 3B | 73.7 mph |
| 20 | Jordan Sheridan | CA | Bonita | 2021 | 1B | 73.2 mph |
| 21 | Samuel DeCarlo | CA | Millikan | 2022 | SS | 72.9 mph |
| ^ | Colby Kiesling | CA | Sage Creek | 2022 | OF | 72.9 mph |
| ^ | Kenneth Wang | CA | Claremont | 2022 | C | 72.9 mph |
| 22 | Jeremy Giesegh | CA | Upland | 2022 | OF | 72.8 mph |
| 23 | Connor Pawlowski | CA | Pioneer | 2021 | C | 72.7 mph |
| ^ | Doug Pyle | CA | La Salle College Prep | 2022 | OF | 72.7 mph |
| 24 | Jake Ellison | CA | St. John Bosco | 2022 | OF | 72.4 mph |
| ^ | Sebastian Ancheta | CA | La Mirada | 2023 | OF | 72.4 mph |
| 25 | Andrew Campbell | CA | King | 2022 | OF | 72.3 mph |
Peak Hand Speed
Peak Hand Speed is the observed maximum speed as measured on the handle of the bat (measured six inches from the knob of the bat). Peak Hand Speed will occur prior to the moment of impact, very close to the commit time in the swing when the wrists unhinge. For more info: Peak Hand Speed
MLB Avg: 23-29 mph | MiLB Avg: 22-28 mph | College Avg: 21-24 mph
Rank
Name
State
School
Class
Pos
Hand Speed (avg)
1
Sam Purgason
CA
Truckee
2022
3B
26.1 mph
2
Connor Pawlowski
CA
Pioneer
2021
C
24.8 mph
3
Nathan Estrada
CA
Yorba Linda
2022
2B
24.5 mph
4
Anthony Beau Manuel
CA
Gahr High
2021
2B
24.0 mph
5
Kade Johnstone
CA
Vista Murrieta
2021
LHP
24.0 mph
6
George Cordero
CA
Redlands East Valley
2022
RHP
24.0 mph
7
Isaiah Alvarado
CA
William S. Hart
2022
OF
23.9 mph
8
Cooper Whitton
CA
Santa Fe Christian
2022
OF
23.7 mph
9
Darian Choi
CA
Sunny Hills
2022
SS
23.7 mph
10
Eddie Mgdesyan
CA
Sierra Canyon
2022
3B
23.4 mph
11
Tripp Garrish
CA
Carlmont
2022
OF
23.4 mph
12
Demarae Woods
CA
Helix Charter
2022
OF
23.3 mph
13
Cain Lusic
CA
San Pedro
2021
SS
23.3 mph
14
Harrison Altschul
CA
Harvard Westlake
2022
OF
23.3 mph
15
Doug Pyle
CA
La Salle College Prep
2022
OF
23.1 mph
16
Joaquin Sandoval
CA
San Marcos
2022
C
23.1 mph
17
Corbin Ybarra
CA
IMG Academy
2022
OF
22.9 mph
18
Steve Arteaga
CA
Vista Murrieta
2022
C
22.9 mph
19
Ivan Niebla
CA
Citrus
2022
RHP
22.9 mph
20
Tyler Norgaard
CA
San Juan Hills
2021
2B
22.8 mph
21
Samuel DeCarlo
CA
Millikan
2022
SS
22.7 mph
22
Austin Overn
CA
Foothill
2022
OF
22.7 mph
23
Cameron Shimokawa
CA
Diamond Ranch
2021
C
22.7 mph
24
Bryce Gamble
CA
El Dorado
2021
C
22.5 mph
25
Keone Takahashi
CA
Northgate
2022
RHP
22.3 mph
Avg. On Plane Efficiency
Measures the percentage of your swing where the bat is on the swing plane. Your vertical bat angle at contact establishes the plane for that swing. Plane is a great indicator for making more consistent contact on the barrel of the bat. For more info: On Plane Efficiency
Ideal Efficiency %: 70% or Higher | Range: 65%-85%
| Rank | Name | State | School | Class | Pos | On Plane Eff (avg) |
| 1 | Kaleb Duran | CA | Summit | 2021 | 2B | 87 % |
| 2 | Joey Fonseca | CA | El Diamante | 2021 | 3B | 87 % |
| 3 | Nathan Estrada | CA | Yorba Linda | 2022 | 2B | 86 % |
| 4 | Jeremy Giesegh | CA | Upland | 2022 | OF | 85 % |
| 5 | Sawyer Spivey | CA | Irvine | 2022 | RHP | 84 % |
| 6 | Harrison Altschul | CA | Harvard Westlake | 2022 | OF | 83 % |
| 7 | Owen Fuller | CA | JSerra | 2022 | 2B | 82 % |
| 8 | Mathew Fonseca | CA | Bishop Amat | 2022 | 3B | 81 % |
| 9 | Aaron Clark | CA | El Dorado | 2021 | 2B | 81 % |
| 10 | Casey Best | CA | Saugus | 2022 | OF | 80 % |
| 11 | Tripp Garrish | CA | Carlmont | 2022 | OF | 79 % |
| 12 | Doug Pyle | CA | La Salle College Prep | 2022 | OF | 79 % |
| 13 | Keone Takahashi | CA | Northgate | 2022 | RHP | 78 % |
| 14 | Ryan Moreno | CA | Ayala | 2021 | OF | 78 % |
| 15 | Andrew Campbell | CA | King | 2022 | OF | 77 % |
| 16 | Ryder Edwards | CA | Paraclete | 2022 | RHP | 77 % |
| 17 | George Cordero | CA | Redlands East Valley | 2022 | RHP | 76 % |
| 18 | Connor Pawlowski | CA | Pioneer | 2021 | C | 75 % |
| 19 | Isaac Sandoval | CA | Foothill | 2022 | SS | 74 % |
| 20 | Darian Choi | CA | Sunny Hills | 2022 | SS | 74 % |
| 21 | Isaiah Alvarado | CA | William S. Hart | 2022 | OF | 74 % |
| 22 | Justin Cabada | CA | Brea Olinda | 2022 | OF | 73 % |
| 23 | Lucas Marlowe | CA | California | 2022 | C | 72 % |
| 24 | Tyler Norgaard | CA | San Juan Hills | 2021 | 2B | 71 % |
| 25 | Scotty Pieper | CA | Valencia | 2022 | OF | 71 % |
Max Rotational Acceleration
Measures how quickly your bat accelerates into the swing plane. Rotation is a good indicator of how you build bat speed by sequencing properly. The quicker your rotational acceleration, the more power you will have and the more time you have to adjust to pitch locations. For more info: Rotational Acceleration
MLB Avg: 16.8 g | MiLB Avg: 12.6 g | College Avg: 12.9 g
| Rank | Name | State | School | Class | Pos | Rot. Acc (max) |
| 1 | Anthony Beau Manuel | CA | Gahr High | 2021 | 2B | 37.6 g |
| 2 | Christopher Landaas | CA | San Juan Hills | 2021 | 1B | 33.8 g |
| 3 | Connor Pawlowski | CA | Pioneer | 2021 | C | 33.1 g |
| 4 | George Cordero | CA | Redlands East Valley | 2022 | RHP | 30.9 g |
| 5 | Nathan Estrada | CA | Yorba Linda | 2022 | 2B | 28.5 g |
| 6 | Johnathan Shell | CA | Summit | 2021 | OF | 28.2 g |
| 7 | Darian Choi | CA | Sunny Hills | 2022 | SS | 27.9 g |
| 8 | Steve Arteaga | CA | Vista Murrieta | 2022 | C | 26.3 g |
| 9 | Michael McQueen | CA | San Bernardino Valley College | 2022 | OF | 26.2 g |
| 10 | Sawyer Spivey | CA | Irvine | 2022 | RHP | 25.2 g |
| 11 | Jeremy Giesegh | CA | Upland | 2022 | OF | 24.9 g |
| 12 | Jeremy Camarena | CA | St. Joseph | 2022 | SS | 24.3 g |
| 13 | Eddie Mgdesyan | CA | Sierra Canyon | 2022 | 3B | 22.1 g |
| 14 | Isaiah Alvarado | CA | William S. Hart | 2022 | OF | 21.9 g |
| 15 | Kaleb Duran | CA | Summit | 2021 | 2B | 21.7 g |
| 16 | Ryan Moreno | CA | Ayala | 2021 | OF | 20.9 g |
| 17 | Jordan Sheridan | CA | Bonita | 2021 | 1B | 20.6 g |
| 18 | Kenneth Wang | CA | Claremont | 2022 | C | 20.4 g |
| 19 | Kade Johnstone | CA | Vista Murrieta | 2021 | LHP | 19.9 g |
| 20 | Doug Pyle | CA | La Salle College Prep | 2022 | OF | 19.7 g |
| 21 | Ryan Chavez | CA | Yorba Linda | 2021 | 2B | 19.5 g |
| ^ | Lucas Marlowe | CA | California | 2022 | C | 19.5 g |
| 22 | Andrew Campbell | CA | King | 2022 | OF | 19.0 g |
| 23 | Paul Murrow | CA | Beckman | 2021 | OF | 18.9 g |
| 24 | Ryan Matsukawa | CA | Mira Costa | 2022 | OF | 18.6 g |
| ^ | Bryce Gamble | CA | El Dorado | 2021 | C | 18.6 g |
| 25 | Tyler Norgaard | CA | San Juan Hills | 2021 | 2B | 18.4 g |
Power
The average Power generated during the swing is found from the effective mass of the bat, the Bat Speed at impact, and the average acceleration during the downswing. Power is measured in Watts. Higher Power is achieved when a hitter is able to swing a heavier bat and accelerate it to higher speeds. For more info: Power
MLB Avg: 3.65-5.65 kW | MiLB Avg: 3.20-5.20 kW | College Avg: 3.83-5.08 kW
| RANK | NAME | STATE | SCHOOL | GRAD | Power (kW’s) |
| 1 | Bryce Gamble | CA | El Dorado | 2021 | 5.24 kW |
| 2 | Steve Arteag | CA | Vista Murrieta | 2021 | 5.15 kW |
| 3 | Crobin Ybarra | CA | Buchanan | 2022 | 5.06 kW |
| 4 | Anthony Beau Manuel | CA | Gahr | 2021 | 4.94 kW |
| ^ | Keone Takahashi | CA | Northgate | 2022 | 4.94 kW |
| 5 | Austin Overn | CA | Foothill HS | 2022 | 4.90 kW |
| 6 | Connor Pawlowski | CA | Pioneer | 2021 | 4.86 kW |
| 7 | Jordan Sheridan | CA | Bonita | 2021 | 4.80 kW |
| 8 | George Cordero | CA | Redlands East Valley | 2022 | 4.74 kW |
| 9 | Harrison Altschul | CA | Harvard Westlake | 2022 | 4.72 kW |
| 10 | Damien Delgadillo | CA | Ayala | 2021 | 4.70 kW |
| 11 | Nathan Estrada | CA | Yorba Linda | 2022 | 4.65 kW |
| 12 | Noah Sharar | CA | Sage Creek | 2022 | 4.50 kW |
| 13 | Ryan Chavez | CA | Yorba Linda | 2021 | 4.49 kW |
| 14 | Tyler Norgaard | CA | San Juan Hills | 2021 | 4.48 kW |
| 15 | Michale McQueen | CA | Cajon | 2022 | 4.44 kW |
| 16 | Eddie Mgdesyan | CA | Sierra Canyon | 2022 | 4.32 kW |
| 17 | Darian Choi | CA | Sunny Hills | 2021 | 4.27 kW |
| ^ | Julian Eskridge | CA | Arcadia | 2021 | 4.27 kW |
| 18 | Isaiah Alvarado | CA | Hart | 2022 | 4.19 kW |
| ^ | Paul Murrow | CA | Beckman | 2021 | 4.19 kW |
| ^ | Kenneth Wang | CA | Claremont | 2021 | 4.19 kW |
| 19 | Sam DeCarlo | CA | Millikan | 2022 | 4.15 kW |
| 20 | Jeremy Giesegh | CA | Upland | 2021 | 4.14 kW |
RELATED TOPICS
- CA Uncommitted Spotlight: '25 SS/2B Wyatt Hanoian 5/10/24
- CA Uncommitted Spotlight: '25 3B John Bullock 5/09/24
- CA Hardy's Hits: CIF SS & CS Coverage 4/23 - 5/7 5/08/24
- CA Uncommitted Spotlight: '25 RHP Mason Kang 5/08/24
- CA Uncommitted Spotlight: '25 C Evan Wied 5/07/24
- CA Uncommitted Spotlight: '25 RHP Alex Stern 5/06/24
- CA NorCal Central Section Game of the Week: 5/6 - 5/11 5/06/24
- CA SoCal LA City Section Game of the Week: 5/6 - 5/11 5/06/24
- CA SoCal San Diego Section Game of the Week: 5/6 - 5/11 5/06/24
- CA Uncommitted Spotlight: '25 C/1B Jack Quirk 5/03/24