Trackman Traits- Hitting: 2023 3B/OF Ethan Gallo (Minisink Valley)
January 28, 2021
Welcome back to the hitting side of Trackman Traits. In this series we will spotlight one player each week who stood out during this 2020 season and take a deeper dive into their numbers and take a look at some that really stand out. Since the implementation of the Trackman technology to our showcases this summer we have been fortunate enough to have seen a great deal of talent come through the system. Today, we will be taking a look at the number one third basemen in New York's 2023 class, Ethan Gallo
Before we get started, we'll go over and define some of the terminology being used in the piece.
Exit Velocity- this one's pretty simple but this metric measures the speed of the ball off the bat, measured in miles per hour (MPH).
Distance- another simple one, this metric measures how far the ball traveled or would travel if it was not obstructed, measured in feet.
Launch Angle- measures the vertical angle of the ball as it leaves the bat. Positive numbers represent balls traveling upward off of the bat and negative numbers mean the ball is traveling downward off of the bat.
Fly Ball %- Percentage of fly balls hit during a given set of batted ball events. Trackman defines a fly ball as any batted ball with a launch angle between 25 degrees and 49.9 degrees.
Line Drive%- Percentage of line drives hit during a given set of batted ball events. Trackman defines a line drive as any batted ball with a launch angle between 10 degrees and 24.9 degrees.
Ground Ball %- Percentage of ground balls hit during a given set of batted ball events. Trackman defines a ground ball as any batted ball with a launch angle below 9.9 degrees.
Hard Hit%- Percentage of batted balls with an exit velocity of 90 MPH or higher.
Bat Speed- The speed of the sweet spot of the bat at impact, measured in MPH. The sweet spot is measured 6 inches from the tip of the bat. - Blast Motion
Hand Speed- The speed of the handle of the bat just before impact, measured in MPH. The handle us measured 6 inches from the knob of the bat. - Blast Motion
Rotational Acceleration- A measure of how quickly the hitter gets from launch position to being on plane. This is measured in G-Force (g). - Blast Motion
On Plane Efficiency %- A measure of the percentage of your swing that was on the swing plane. -Blast Motion

Ethan Gallo
Class of 2023 / OF
Player Information
-
Graduating Class: 2023
-
Primary Position: OFSecondary Position: 3B
-
High School: Minisink ValleyState: NY
- Summer Team: Northeast Pride
-
Height: 6-0Weight: 220lbs
- Bat/Throw: L/R
Statistics


Vizual_Edge
Swift
Videos
(10/24/20)
Player News
- Uncommitted Spotlight: 2023 INF/OF Ethan Gallo (Minisink Valley) - Aug 16, 2022
- Year in Review: Peak Bat Speed via Blast Motion / Class of 2023 - Jan 8, 2022
- Year in Review: Peak Batted Ball Distance via Trackman / Class of 2023 - Dec 20, 2021
- Year in Review: Peak Exit Velocity via Trackman / Class of 2023 - Dec 13, 2021
- Future Games: Top Bat Speed (Peak) - Aug 19, 2021
- Future Games: Team NY Top Exit Velo - Jul 31, 2021
- State Games: Top Exit Velo (AVG) - Jul 21, 2021
- State Games: Top Batted Ball Distance - Jul 8, 2021
- Year in Review - Top Bat Exit Velocity of 2020 / Class of 2023 - Jan 8, 2021
- Year in Review - Top Bat Speed (Avg) of 2020 / Class of 2023 - Dec 22, 2020
- Labor Day Scout Weekend - Day 2 Scout Blog - Sep 8, 2020
TRACKMAN DATA ANALYSIS
We got the opportunity to catch up with Gallo a couple times last fall at the 2020 Last Chance Preview-Downstate event and the 2020 Northeast Pride Scout Day. While he put up some big numbers at both events, we'll be diving into the numbers from his showing at the Northeast Pride Scout Day. Let's get into it.
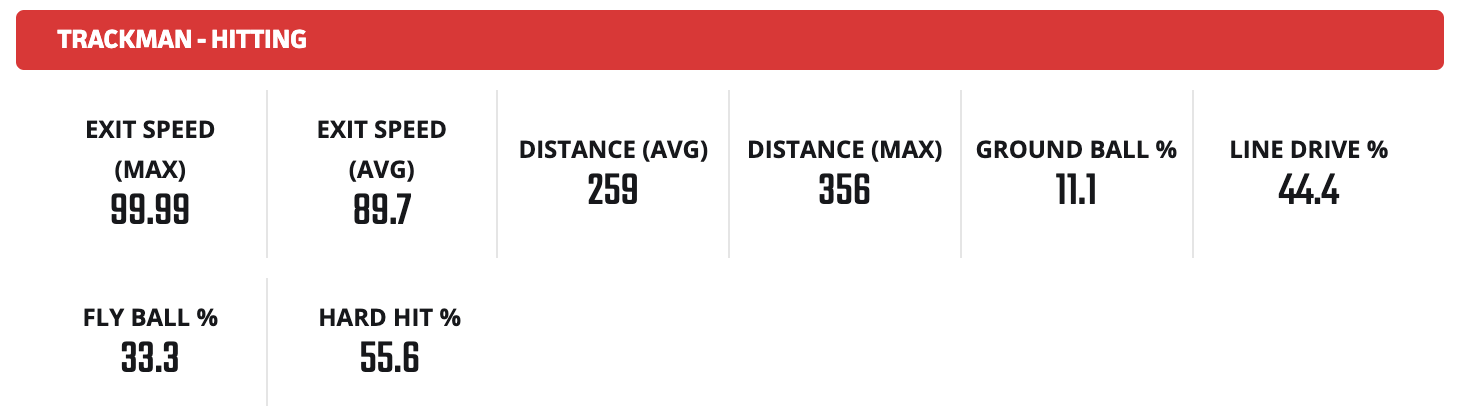
Exit Velocity- This is where Gallo stood out the most, his max exit velo coming in at 99.99 MPH. I'm a fair guy, I'll give him that .01 MPH and just say he's a member of the triple digit exit velo club. In a game that is becoming more and more velocity oriented, being someone with the ability to get up to triple digits is a good way to follow that trend. His average exit velocity fell down to just below 90 MPH, but we have seen his average exit velocity at nearly 92 MPH in prior events, so the ability to hit the barrel the ball up consistently is there. His max exit velo topped the leaderboards for the Northeast Pride Scout Day and his average exit velocity was good for second, and the sound off of his bat certainly backs those numbers up.
Distance- Speaking of leaderboards for this event, Gallo found himself in the top five for both his average distance and max distance. That 356 ft blast found its way over the RF wall at Dutchess Stadium in Fishkill, NY and he peppered the right side with regularity during his BP round. The average distance of 259 ft is up from what we have seen from him in the past as he eliminated some ground balls from his last event.
Batted Ball Percentages- Gallo has a nice dispersion of his batted balls, with 44.4% being line drives and 33.3% being fly balls. For someone with his exit velocity capabilities, this is right around where you'd like to see these numbers. Hitting the ball hard is usually a great start to finding success at the plate, and he could even stand to raise that fly ball percentage as he could increase his damage that way. His hard hit percentage was at 55.6% for this event, so he hit the ball over 90 MPH over half the time. Generally I like to see a little bit of a higher number in this category as it is a good indicator of repeated success, but we have seen him up to a 76.9 % hard hit percentage in previous events, so I believe in his ability to barrel it up with consistency.
BLAST CONNECTION
Trackman does a great job showing the outcomes of players swings and their batted ball events. Its data is results based, the best numbers come when you get off your best swing and make your best contact. Blast Motion technology, also implemented at the same time this summer as the Trackman, tracks the swing data of a player and can shine a light into what a player does well in their swing. When paired with Trackman data, it can paint a more complete picture of a hitter and help explain why a player is able to hit the ball harder, farther, and more consistently than others.
Gallo put up some solid Blast Motion metrics to back up the big numbers he put up on the Trackman. The first metric that catches my eye is his rotational acceleration. He is a high rotational guy, with his max being 21 G's and his average at 16.48 G's. Driveline considers anyone with higher than 15 G's to have high rotational acceleration, meaning they sequence well and use their core and legs to help generate bat speed. Speaking of bat speed, both his max bat speed of 77.6 MPH and average bat speed of 75.84 MPH were also above the high school averages between 57-71 MPH. His ability to swing it that quickly, along with the physicality he shows in his 5-foot-11, 210 pound frame leaves no questions as to how he is able to generate the power he does. If he can improve upon his on-plane efficiency % from 64% to above that magic number of 70% in this category, he should be able to improve upon his consistency in hitting the ball as hard as he does and find even more success in the future.
CONCLUSION
Ethan Gallo put up some big numbers this fall and was able to join the triple digits exit velo club with his high intent swing from the left side. We're looking forward catching up with the uncommitted '23 this season to see if he can improve upon some of his already impressive numbers.

- NY Trackman Traits: 2024 OF/RHP Jordan Perry (Franklin Academy) 5/19/23
- NY Trackman Traits- Hitting: 2022 OF Matthew Canizares (Monsignor McClancy) 2/11/21
- NY Trackman Traits - Pitching: 2021 RHP Connor McCreery (Saint Anthony's) 2/08/21
- NY Trackman Traits- Hitting: 2024 C Noah Wasiura (West Seneca West) 2/04/21
- NY Trackman Traits - Pitching: 2022 RHP Aidan Chamberlin (Corning-Painted Post) 2/01/21
UPCOMING EVENTS