AL/MS Border Battle: Trackman Files
October 18, 2023
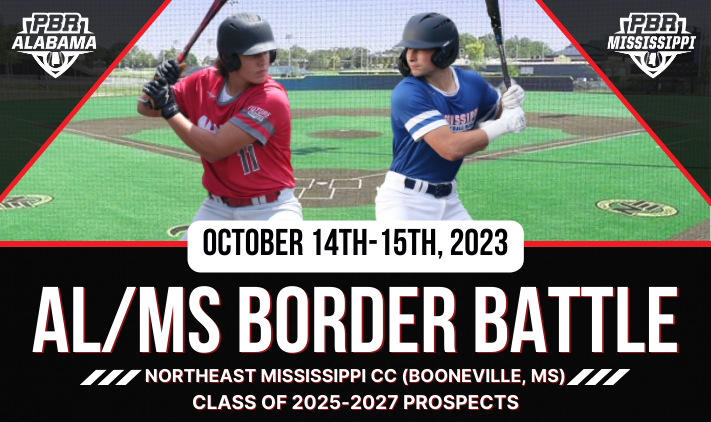
BOONEVILLE, MS - The AL/MS Border Battle was held on October 14th-15th at Northeast Mississippi CC in Booneville, MS. This was an invite-only event that consisted of prospects in the 2025, 2026, & 2027 classes from both Alabama & Mississippi. These players went through a pro-style workout on Saturday and took batting practice using Trackman to record hitting metrics, then followed it up with gameplay on Sunday with pitchers throwing multiple innings. To see full statistics gathered from the event, CLICK HERE. There were some players who showed up and continued to build off of prior performances, but there were also some new names who jumped onto our radar with a strong showing this weekend.
+ To view the updated Player Rankings, CLICK HERE.
+ Interested in attending an event? CLICK HERE for event schedule.
+ To stay updated on news around the Yellowhammer State, CLICK HERE.
+ Follow us on Twitter, @PBR_ALABAMA.
Continuing off our post-event coverage for this event, we take a look back at some of the leaders from each statistical category recorded on the Trackman B1 unit. Please continue to check back over the next week, as we will release individual scouting reports on each player present at the event.
View entire event stats HERE.
MAX FASTBALL & AVERAGE SPIN RATE
| Rank | Name | State | School | Class | Pos | Velocity (max) |
| 1 | Caleb Barnett | AL | Mountain Brook | 2025 | 3B | 88.7 mph |
| 2 | Jon Grey Morrisson | MS | WEST UNION ATTENDANCE CENTER | 2026 | 3B | 87.0 mph |
| 3 | Jack Doyle | AL | Madison Academy | 2025 | RHP | 86.8 mph |
| 4 | Charlie Cassingham | AL | Virgil Grissom High School | 2025 | SS | 85.9 mph |
| 5 | Cannon Turner | MS | Purvis | 2025 | 3B | 85.4 mph |
| 6 | Jackson Howell | MS | AMORY HIGH SCHOOL | 2025 | LHP | 85.2 mph |
| 7 | Brody Roberts | MS | Manchester Academy | 2025 | RHP | 84.6 mph |
| 8 | Wyatt Williams | AL | Bayside Academy | 2026 | 1B | 84.4 mph |
| 9 | Noel LeBlanc | MS | LAUSANNE COLLEGIATE SCHOOL | 2025 | RHP | 84.2 mph |
| 10 | Ayden Wilbanks | MS | KOSSUTH HIGH SCHOOL | 2026 | 3B | 84.2 mph |
| Rank | Name | State | School | Class | Pos | Spin Rate (avg) |
| 1 | Cannon Turner | MS | Purvis | 2025 | 3B | 2355 rpm |
| 2 | Noel LeBlanc | MS | LAUSANNE COLLEGIATE SCHOOL | 2025 | RHP | 2337 rpm |
| 3 | Caleb Barnett | AL | Mountain Brook | 2025 | 3B | 2296 rpm |
| 4 | Jack Ross | AL | Homewood High School | 2025 | 3B | 2253 rpm |
| 5 | Charlie Cassingham | AL | Virgil Grissom High School | 2025 | SS | 2194 rpm |
Max Fastball Velocity: This metric calculates the speed of the pitch as it’s released from the pitcher’s hand.
Spin Rate: This metric calculates the rate of spin on the baseball as it leaves the pitcher’s hand, measured in revolutions per minute (rpm). Historical data shows that high-spin fastballs lessen the impact of gravity, allowing for more ‘rise’ (or less fall, in other words) as it carries through the zone. Low-spin fastballs typically indicate the pitch has greater horizontal action, often making it tougher to square up, but generally easier to make contact with, leading to more ground balls, while high-spin fastballs show a correlation with swings and misses.
AVERAGE FASTBALL HORIZONTAL MOVEMENT
| Rank | Name | State | School | Class | Pos | HM (avg) |
| 1 | Jack Blanchard | AL | Daphne High School | 2026 | OF | 15.5 |
| 2 | Payton Hunsaker | AL | Chelsea High School | 2025 | LHP | -14.9 |
| 3 | Karter Perry | AL | Pell City High School | 2026 | OF | -14.0 |
| 4 | Jon Grey Morrisson | MS | WEST UNION ATTENDANCE CENTER | 2026 | 3B | 13.5 |
| 5 | Stone Myrick | MS | St. Andrews Episcopal | 2025 | 1B | 11.8 |
Horizontal Break: Outlined on TrackMan’s own website: “... horizontal movement is measured in inches between where the pitch actually crosses the front of home plate side-wise, and where it would have crossed home plate side-wise if had it traveled in a perfectly straight line from release. A positive number means the break was to the right from the pitcher’s perspective, while a negative number means the break was to the left from the pitcher’s perspective.”
AVERAGE CURVEBALL SPIN RATE
| Rank | Name | State | School | Class | Pos | Spin Rate (avg) |
| 1 | Noel LeBlanc | MS | LAUSANNE COLLEGIATE SCHOOL | 2025 | RHP | 2671 rpm |
| 2 | Charlie Cassingham | AL | Virgil Grissom High School | 2025 | SS | 2582 rpm |
| 3 | Rhys Jones | AL | Spain Park High School | 2026 | SS | 2515 rpm |
| 4 | Brody Roberts | MS | Manchester Academy | 2025 | RHP | 2442 rpm |
| 5 | DJ Blackwood | AL | Daphne | 2027 | LHP | 2245 rpm |
Spin Rate: The metric calculates how fast the ball is spinning as it leaves the pitcher’s hand, reported in the number of times the pitched ball would spin per minute (“revolutions per minute” or “rpm”).
AVERAGE SLIDER SPIN RATE
| Rank | Name | State | School | Class | Pos | Spin Rate (avg) |
| 1 | Jack Ross | AL | Homewood High School | 2025 | 3B | 2439 |
| 2 | Levi Pinder | AL | GLENWOOD SCHOOL | 2025 | 3B | 2407 |
| 3 | Payton Hunsaker | AL | Chelsea High School | 2025 | LHP | 2197 |
| 4 | Corbyn Clayton | MS | Pontotoc City | 2026 | SS | 2181 |
| 5 | Clark Janzen | MS | BOONEVILLE HIGH SCHOOL | 2025 | RHP | 2145 |
Spin Rate: The metric calculates how fast the ball is spinning as it leaves the pitcher’s hand, reported in the number of times the pitched ball would spin per minute (“revolutions per minute” or “rpm”).
AVERAGE CHANGEUP HORIZONTAL MOVEMENT
| Rank | Name | State | School | Class | Pos | HM (avg) |
| 1 | Payton Hunsaker | AL | Chelsea High School | 2025 | LHP | -17.7 |
| 2 | DJ Blackwood | AL | Daphne | 2027 | LHP | -16.2 |
| 3 | Hudson Campbell | AL | Glenwood | 2026 | OF | -14.0 |
| 4 | Cole Gideon | MS | JACKSON PREPARATORY SCHOOL | 2025 | OF | -12.6 |
| 5 | Ayden Wilbanks | MS | KOSSUTH HIGH SCHOOL | 2026 | 3B | 12.2 |
Horizontal Break: This metric measures the distance, measured in inches, between where the pitch actually crosses the front of home plate side-wise, and where it would have crossed home plate side-wise if had it traveled in a perfectly straight line from release. A positive number means the break was to the right from the pitcher’s perspective, while a negative number means the break was to the left from the pitcher’s perspective.
PEAK EXIT VELOCITY (HITTING)
| Rank | Name | State | School | Class | Pos | Exit Velocity (max) |
| 1 | Zackary Johnson | AL | Bob Jones | 2025 | C | 102.9 mph |
| 2 | James Lucas | AL | Vestavia Hills High School | 2025 | C | 102.0 mph |
| 3 | Tinnin Potts | MS | CLINTON HIGH SCHOOL | 2025 | 3B | 99.5 mph |
| 4 | Charley Dunn | MS | Washington School | 2025 | C | 97.9 mph |
| 5 | Cole Gideon | MS | JACKSON PREPARATORY SCHOOL | 2025 | OF | 97.2 mph |
| 6 | Jack Ross | AL | Homewood High School | 2025 | 3B | 97.0 mph |
| 7 | Nick Peters | AL | Helena High School | 2025 | C | 96.8 mph |
| 8 | Wyatt Williams | AL | Thompson High School | 2026 | RHP | 95.0 mph |
| 9 | Justin Word | MS | St. Andrew's Episcopal | 2026 | SS | 94.9 mph |
| 10 | Levi Pinder | AL | GLENWOOD SCHOOL | 2025 | 3B | 94.4 mph |
Exit Velocity: This metric measures the speed of the ball, measured in miles per hour, as it comes off the bat at the moment of contact.
PEAK ESTIMATED BATTED DISTANCE (HITTING)
| Rank | Name | State | School | Class | Pos | Distance (max) |
| 1 | Tinnin Potts | MS | CLINTON HIGH SCHOOL | 2025 | 3B | 365 ft |
| 2 | Wyatt Williams | AL | Thompson High School | 2026 | RHP | 362 ft |
| 3 | Cole Gideon | MS | JACKSON PREPARATORY SCHOOL | 2025 | OF | 361 ft |
| 4 | JB Upton | AL | Auburn High School | 2027 | SS | 358 ft |
| 5 | Stone Myrick | MS | St. Andrews Episcopal | 2025 | 1B | 358 ft |
| 6 | Zackary Johnson | AL | Bob Jones | 2025 | C | 354 ft |
| 7 | Charley Dunn | MS | Washington School | 2025 | C | 351 ft |
| 8 | Charlie Cassingham | AL | Virgil Grissom High School | 2025 | SS | 350 ft |
| 9 | Collin Smith | MS | PARKLANE ACADEMY | 2025 | 3B | 348 ft |
| 10 | Memphis Scott | AL | Madison County High School | 2025 | 3B | 345 ft |
Distance: This metric measures the estimated “carry flat” distance, measured in feet, meaning the distance that the ball travels before it lands, or would have landed if it were not caught or obstructed.
+ Follow on Twitter: @PBR_Alabama
+ Follow on Instagram: @PBR_Alabama
+ Follow on Facebook: PBR Alabama
+ Click HERE to create a free profile.
+ Click HERE to purchase a subscription which gives you access to additional information on the site.
Related Content: