Huntsville Preseason ID: Data Dive, Pitchers
January 12, 2024
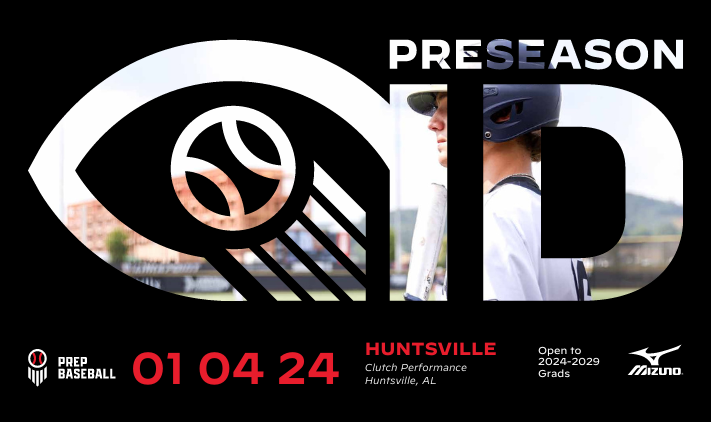
HUNTSVILLE, AL - The Huntsville Preseason ID was held on Thursday, January 4th at Clutch Performance in Huntsville, AL. This event was an open event that consisted of prospects from the 2024-2029 classes. These players went through extended pro-style workout that included batting practice using Trackman and Blast Motion, ran the 30 yard dash using Swift Performance, and much more. Pitchers were able to throw in simulated bullpens during the workout and were able to get numbers and metrics off of our Trackman unit, such as pitch velocity, spin rate, horizontal & vertical movement & much more. There were some players who showed up and continued to build off of prior performances, but there were also some new names who jumped onto our radar with a strong showing on Thursday.
Last week, we broke down the stat leaders from the more traditional categories in our statistical analysis. Today, we will take an even closer look at the pitchers in attendance with the help of our tech partners, broken down by the categories and leaderboards below.
FASTBALL
MAX VELOCITY (MPH)
| Rank | Name | State | School | Class | Pos | Velocity (max) |
| 1 | Joshua Henson | AL | Buckhorn | 2025 | SS | 88.6 mph |
| 2 | Evan Dodd | AL | Whitesburg Christian | 2024 | RHP | 85.0 mph |
| 3 | Aiden Kletke | AL | Sparkman High School | 2024 | OF | 83.7 mph |
| 4 | Jackson Davis | AL | Virgil Grissom High School | 2025 | 3B | 83.2 mph |
| 5 | Graham Segraves | AL | Bob Jones | 2027 | RHP | 82.2 mph |
SPIN RATE (AVG.)
| Rank | Name | State | School | Class | Pos | Spin Rate (avg) |
| 1 | Evan Dodd | AL | Whitesburg Christian | 2024 | RHP | 2387 rpm |
| 2 | Joshua Henson | AL | Buckhorn | 2025 | SS | 2295 rpm |
| 3 | Brenner VanDeWynckel | AL | Sparkman High School | 2026 | LHP | 2248 rpm |
| 4 | Jackson Davis | AL | Virgil Grissom High School | 2025 | 3B | 2238 rpm |
| 5 | David Potts | AL | Skyline | 2028 | RHP | 2197 rpm |
Spin Rate: This metric calculates the rate of spin on the baseball as it leaves the pitcher’s hand, measured in revolutions per minute (rpm). Historical data shows that high-spin fastballs lessen the impact of gravity, allowing for more ‘rise’ (or less fall, in other words) as it carries through the zone. Low-spin fastballs typically indicate the pitch has greater horizontal action, often making it tougher to square up, but generally easier to make contact with, leading to more ground balls, while high-spin fastballs show a correlation with swings and misses.
SPIN EFFICIENCY% (AVG.)
| Rank | Name | State | School | Class | Pos | Spin Efficiency % (avg) |
| 1 | Jackson Davis | AL | Virgil Grissom High School | 2025 | 3B | 98 % |
| 2 | Brenner VanDeWynckel | AL | Sparkman High School | 2026 | LHP | 97 % |
| 3 | Burke Garrett | AL | Whitesburg Christian Academy | 2026 | LHP | 94 % |
| 4 | Kaleb Robinson | AL | Whitesburg Christian | 2025 | RHP | 92 % |
| 5 | Truitt Taylor | AL | Huntsville High School | 2025 | RHP | 91 % |
Spin Efficiency: This metric is the percentage of the raw spin rate that directly impacts pitch movement; so while raw spin is measured by revolutions per minute (rpm), spin efficiency is the ratio of true spin divided by raw spin. It’s important to understand that more is not always better when it comes to spin efficiency. The optimal spin efficiency on a pitch depends on the pitch type and should be understood in the context of a pitcher’s entire arsenal. Regarding the true four-seam fastball, a spin efficiency close to 100 percent is preferable, indicating that nearly all the backspin generated on the ball as it leaves the pitcher’s hand is contributing to the “riding” action the pitch has as it enters and exits the strike zone, making it especially effective in the upper third of the strike zone.
INDUCED VERTICAL BREAK (AVG.)
| Rank | Name | State | School | Class | Pos | IVB (avg) |
| 1 | Burke Garrett | AL | Whitesburg Christian Academy | 2026 | LHP | 23.3 in |
| 2 | Kaleb Robinson | AL | Whitesburg Christian | 2025 | RHP | 19.2 in |
| 3 | Brenner VanDeWynckel | AL | Sparkman High School | 2026 | LHP | 18.2 in |
| 4 | Jackson Davis | AL | Virgil Grissom High School | 2025 | 3B | 17.0 in |
| 5 | Cayden McCormack | AL | Wilson | 2026 | RHP | 16.6 in |
Induced Vertical Break: Used in short form as "IVB," this metric is most important on fastballs for creating rise and on curveballs for creating depth – it can also have some use when measuring sliders and cutters as well. Sliders tend to be closer to zero inches while cutters are generally between 5 and 15 inches. Usually fastballs and curveballs with large IVB have higher spin efficiencies as well. Sliders generally have very little (closer to zero) IVB and very low spin efficiency. You could also categorize IVB into spin rate as this is part of the “useful movement” you’re looking for. IVB is also a huge part of the vertical approach angle.
HORIZONTAL MOVEMENT (AVG.)
| Rank | Name | State | School | Class | Pos | HM (avg) |
| 1 | Will Jones | AL | Huntsville High School | 2026 | OF | 13.2 |
| 2 | Caleb Vallejo | AL | Grissom | 2024 | RHP | 12.8 |
| 3 | Brenner VanDeWynckel | AL | Sparkman High School | 2026 | LHP | -11.6 |
| 4 | Kaleb Robinson | AL | Whitesburg Christian | 2025 | RHP | 9.5 |
| 5 | Brooks Harris | AL | Hazel Green High School | 2026 | 2B | 9.3 |
Horizontal Break: Outlined on TrackMan’s own website: “... horizontal movement is measured in inches between where the pitch actually crosses the front of home plate side-wise, and where it would have crossed home plate side-wise if had it traveled in a perfectly straight line from release. A positive number means the break was to the right from the pitcher’s perspective, while a negative number means the break was to the left from the pitcher’s perspective.”
STRIKE ZONE RATE%
| Rank | Name | State | School | Class | Pos | Zone % |
| 1 | Jackson Nichols | AL | Scottsboro | 2026 | RHP | 100 % |
| 2 | Zachary Schenck | AL | James Clemens | 2026 | 3B | 71 % |
| 3 | Caleb Vallejo | AL | Grissom | 2024 | RHP | 60 % |
| 4 | Tristan Blalock | AL | James Clemens High School | 2029 | 3B | 57 % |
| ^ | Evan Dodd | AL | Whitesburg Christian | 2024 | RHP | 57 % |
| 5 | Will Jones | AL | Huntsville High School | 2026 | OF | 50 % |
| ^ | Jackson Davis | AL | Virgil Grissom High School | 2025 | 3B | 50 % |
| ^ | Mason Brewer | AL | Hartselle | 2028 | 3B | 50 % |
| ^ | Reece Thomas | AL | Huntsville High School | 2025 | 2B | 50 % |
| ^ | Joshua Henson | AL | Buckhorn | 2025 | SS | 50 % |
| ^ | Brenner VanDeWynckel | AL | Sparkman High School | 2026 | LHP | 50 % |
Average MLB pitchers throw 62 percent strikes, and better pitchers throw strikes 65 percent of the time, or a ratio of roughly 2:1, strikes to balls.
CURVEBALL
SPIN RATE (AVG.)
| Rank | Name | State | School | Class | Pos | Spin Rate (avg) |
| 1 | Kyler Campbell | AL | Buckhorn High School | 2025 | LHP | 2401 rpm |
| 2 | Will Jones | AL | Huntsville High School | 2026 | OF | 2311 rpm |
| 3 | David Potts | AL | Skyline | 2028 | RHP | 2261 rpm |
| 4 | Caleb Vallejo | AL | Grissom | 2024 | RHP | 2247 rpm |
| 5 | Jackson Davis | AL | Virgil Grissom High School | 2025 | 3B | 2244 rpm |
HORIZONTAL MOVEMENT (AVG.)
| Rank | Name | State | School | Class | Pos | HM (avg) |
| 1 | Brooks Harris | AL | Hazel Green High School | 2026 | 2B | -15.8 |
| 2 | David Potts | AL | Skyline | 2028 | RHP | -14.5 |
| 3 | Caleb Vallejo | AL | Grissom | 2024 | RHP | -13.5 |
| 4 | Kaleb Robinson | AL | Whitesburg Christian | 2025 | RHP | -13.0 |
| 5 | Casen Dutton | AL | Priceville | 2026 | RHP | -12.5 |
STRIKE ZONE RATE%
| Rank | Name | State | School | Class | Pos | Zone % |
| 1 | Brenner VanDeWynckel | AL | Sparkman High School | 2026 | LHP | 100 % |
| ^ | Landon Scott | AL | Huntsville High School | 2025 | OF | 100 % |
| ^ | Jackson Nichols | AL | Scottsboro | 2026 | RHP | 100 % |
| 2 | Jackson Davis | AL | Virgil Grissom High School | 2025 | 3B | 75 % |
| ^ | Kaleb Robinson | AL | Whitesburg Christian | 2025 | RHP | 75 % |
| 3 | Truitt Taylor | AL | Huntsville High School | 2025 | RHP | 66 % |
| 4 | Caleb Vallejo | AL | Grissom | 2024 | RHP | 50 % |
| 5 | Warner Johnson | AL | Deshler | 2027 | LHP | 33 % |
| ^ | Casen Dutton | AL | Priceville | 2026 | RHP | 33 % |
| ^ | Jaxon Poag | AL | Mars Hill Bible | 2024 | OF | 33 % |
SLIDER
SPIN RATE (AVG.)
| Rank | Name | State | School | Class | Pos | Spin Rate (avg) |
| 1 | Evan Dodd | AL | Whitesburg Christian | 2024 | RHP | 2383 |
| 2 | Joshua Henson | AL | Buckhorn | 2025 | SS | 2211 |
| 3 | Landon Scott | AL | Huntsville High School | 2025 | OF | 2036 |
| 4 | Cayden McCormack | AL | Wilson | 2026 | RHP | 1986 |
| 5 | Brenner VanDeWynckel | AL | Sparkman High School | 2026 | LHP | 1853 |
HORIZONTAL MOVEMENT (AVG.)
| Rank | Name | State | School | Class | Pos | HM (avg) |
| 1 | Tristan Blalock | AL | James Clemens High School | 2029 | 3B | -16.5 |
| 2 | Cayden McCormack | AL | Wilson | 2026 | RHP | -10.1 |
| 3 | Joshua Henson | AL | Buckhorn | 2025 | SS | -7.8 |
| 4 | Andrew Summers | AL | WHITESBURG CHRISTIAN ACADEMY | 2025 | OF | -6.5 |
| 5 | Jaxon Poag | AL | Mars Hill Bible | 2024 | OF | 0.5 |
STRIKE ZONE RATE%
| Rank | Name | State | School | Class | Pos | Zone % |
| 1 | Jaxon Poag | AL | Mars Hill Bible | 2024 | OF | 100 % |
| ^ | Brenner VanDeWynckel | AL | Sparkman High School | 2026 | LHP | 100 % |
| 2 | Andrew Summers | AL | WHITESBURG CHRISTIAN ACADEMY | 2025 | OF | 50 % |
| 3 | Joshua Henson | AL | Buckhorn | 2025 | SS | 40 % |
| ^ | Landon Scott | AL | Huntsville High School | 2025 | OF | 40 % |
CHANGEUP
SPIN RATE (AVG.)
| Rank | Name | State | School | Class | Pos | Spin Rate (avg) |
| 1 | Jackson Davis | AL | Virgil Grissom High School | 2025 | 3B | 2176 rpm |
| 2 | Landon Scott | AL | Huntsville High School | 2025 | OF | 1924 rpm |
| 3 | Truitt Taylor | AL | Huntsville High School | 2025 | RHP | 1906 rpm |
| 4 | Will Jones | AL | Huntsville High School | 2026 | OF | 1865 rpm |
| 5 | Joshua Henson | AL | Buckhorn | 2025 | SS | 1839 rpm |
HORIZONTAL MOVEMENT (AVG.)
| Rank | Name | State | School | Class | Pos | HM (avg) |
| 1 | Kaleb Robinson | AL | Whitesburg Christian | 2025 | RHP | 16.3 |
| 2 | Joshua Henson | AL | Buckhorn | 2025 | SS | 12.2 |
| 3 | Zachary Schenck | AL | James Clemens | 2026 | 3B | 12.0 |
| 4 | Casen Dutton | AL | Priceville | 2026 | RHP | 9.1 |
| 5 | Will Jones | AL | Huntsville High School | 2026 | OF | 8.1 |
STRIKE ZONE RATE%
| Rank | Name | State | School | Class | Pos | Zone % |
| 1 | Reece Thomas | AL | Huntsville High School | 2025 | 2B | 100 % |
| ^ | Aiden Kletke | AL | Sparkman High School | 2024 | OF | 100 % |
| ^ | Brooks Harris | AL | Hazel Green High School | 2026 | 2B | 100 % |
| ^ | Zachary Schenck | AL | James Clemens | 2026 | 3B | 100 % |
| ^ | Jackson Nichols | AL | Scottsboro | 2026 | RHP | 100 % |
| ^ | Truitt Taylor | AL | Huntsville High School | 2025 | RHP | 100 % |
| 2 | Landon Scott | AL | Huntsville High School | 2025 | OF | 75 % |
| 3 | David Potts | AL | Skyline | 2028 | RHP | 66 % |
| 4 | Will Jones | AL | Huntsville High School | 2026 | OF | 50 % |
| 5 | Casen Dutton | AL | Priceville | 2026 | RHP | 33 % |
| ^ | Graham Segraves | AL | Bob Jones | 2027 | RHP | 33 % |
+ CLICK HERE for a look at the complete statistics from the event.
+ Follow on Twitter: @PBR_Alabama
+ Follow on Instagram: @PBR_Alabama
+ Follow on Facebook: PBR Alabama
+ Click HERE to create a free profile.
+ Click HERE to purchase a subscription which gives you access to additional information on the site.
Related Content: