South AL Preseason All-State: Trackman Files
January 10, 2024
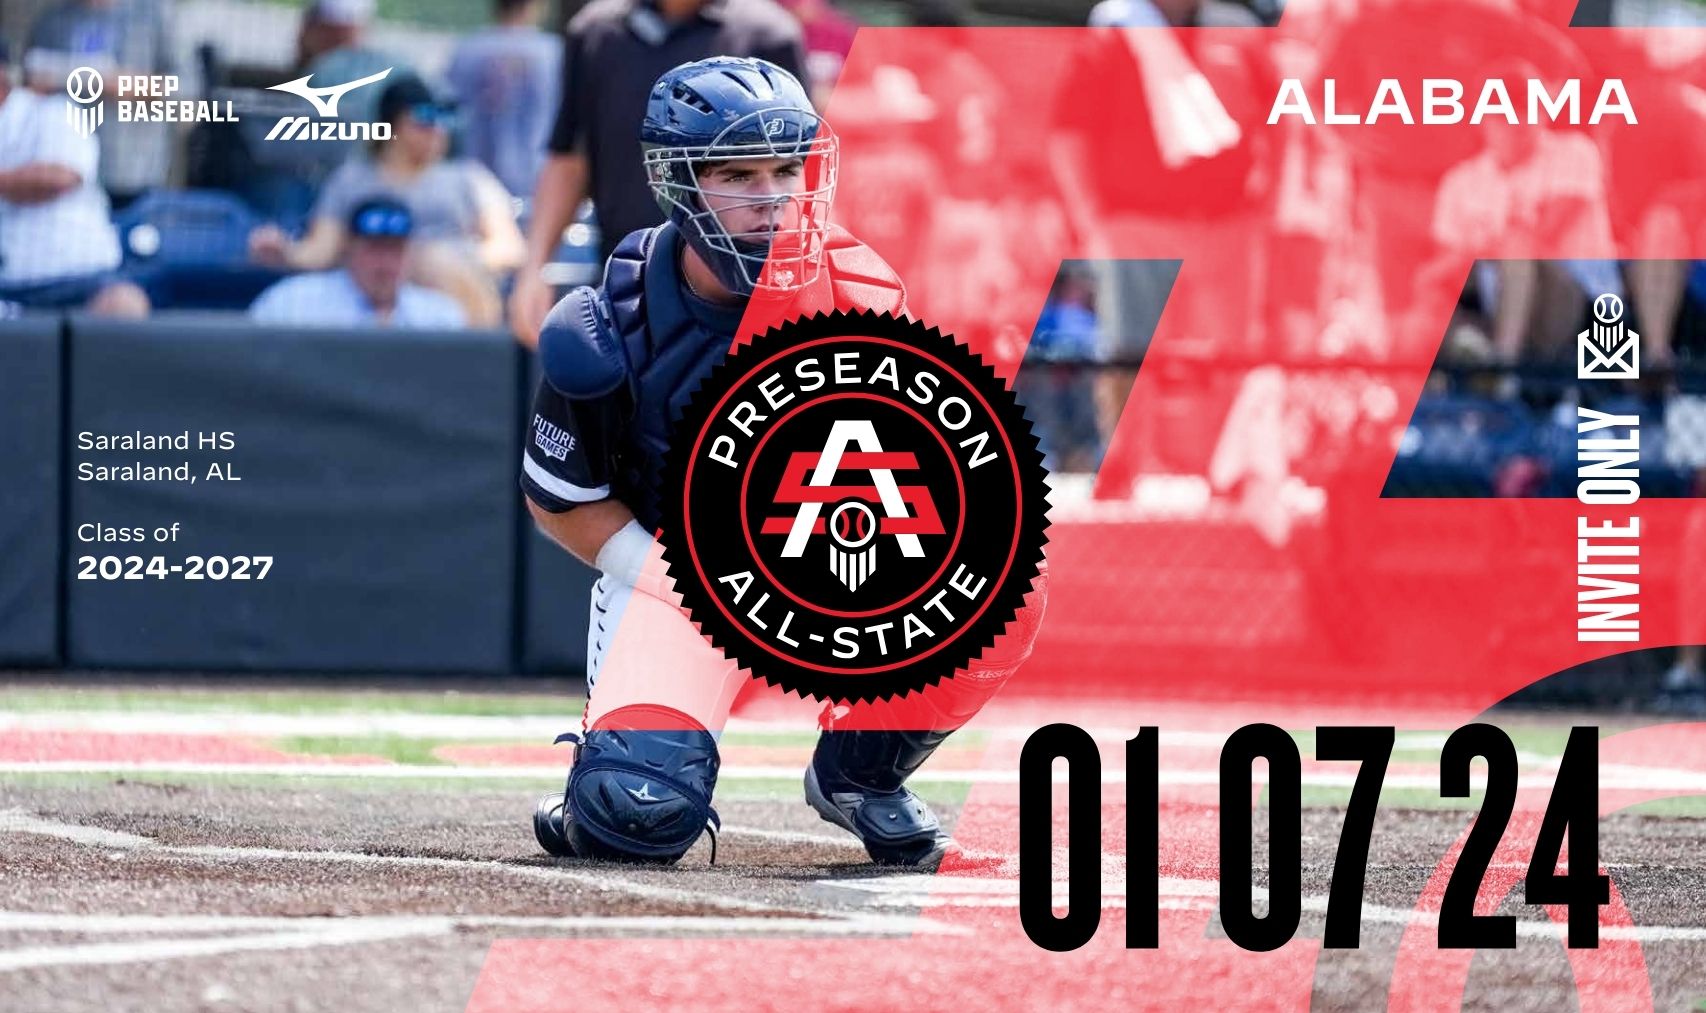
SARALAND, AL - The South AL Preseason All-State was held on Sunday, January 7th at Saraland High School in Saraland, AL. This event was an invite-only event that consisted of some of the top prospects from the 2024-2028 classes. These players went through extended pro-style workout that included batting practice using Trackman and Blast Motion, ran the 60 yard dash using Swift Performance, and much more. Pitchers were able to throw in simulated bullpens during the workout and were able to get numbers and metrics off of our Trackman unit, such as pitch velocity, spin rate, horizontal & vertical movement & much more. There were some players who showed up and continued to build off of prior performances, but there were also some new names who jumped onto our radar with a strong showing on Sunday.
Continuing off our post-event coverage for this event, we take a look back at some of the leaders from each statistical category recorded on the Trackman B1 unit. Please continue to check back over the next week, as we will release individual scouting reports on each player present at the event.
View entire event stats HERE.
MAX FASTBALL & AVERAGE SPIN RATE
| Rank | Name | State | School | Class | Pos | Velocity (max) |
| 1 | Jacob Driver | AL | Marbury | 2025 | RHP | 87.0 mph |
| 2 | Tyler Johnson | AL | Opelika High School | 2025 | C | 86.5 mph |
| 3 | Harrison Cook | AL | Fairhope High School | 2025 | RHP | 86.4 mph |
| 4 | Brady Richardson | AL | Enterprise High School | 2025 | SS | 86.3 mph |
| 5 | Riley Wilemon | AL | Faith Academy | 2026 | RHP | 86.1 mph |
| 6 | Aaron Bailey | AL | McAdory High School | 2026 | 3B | 86.0 mph |
| 7 | Brayden Cooper | AL | Spanish Fort | 2024 | RHP | 85.5 mph |
| 8 | Judson Harris | AL | Gulf Shores | 2027 | OF | 85.0 mph |
| 9 | Jacob Rowell | AL | Saraland | 2026 | RHP | 84.9 mph |
| 10 | Kepler Lively | AL | Chilton County | 2024 | RHP | 82.7 mph |
| Rank | Name | State | School | Class | Pos | Spin Rate (avg) |
| 1 | Riley Wilemon | AL | Faith Academy | 2026 | RHP | 2379 rpm |
| 2 | Brooks McDonald | AL | Saint Paul's | 2025 | 1B | 2181 rpm |
| 3 | Aiden Urnis | AL | Prattville High School | 2026 | SS | 2159 rpm |
| 4 | Harrison Cook | AL | Fairhope High School | 2025 | RHP | 2153 rpm |
| 5 | Landen Booth | AL | Mary G Montgomery | 2025 | RHP | 2118 rpm |
| 6 | Davis Ford | AL | Opelika | 2025 | LHP | 2096 rpm |
| 7 | Brady Richardson | AL | Enterprise High School | 2025 | SS | 2093 rpm |
| 8 | Brodie Wilson | AL | FAITH ACADEMY | 2027 | RHP | 2081 rpm |
| 9 | Carter McCammon | MS | Resurrection Catholic | 2025 | 3B | 2068 rpm |
| 10 | Parker Cranmore | AL | Daphne | 2027 | 3B | 2056 rpm |
Max Fastball Velocity: This metric calculates the speed of the pitch as it’s released from the pitcher’s hand.
Spin Rate: This metric calculates the rate of spin on the baseball as it leaves the pitcher’s hand, measured in revolutions per minute (rpm). Historical data shows that high-spin fastballs lessen the impact of gravity, allowing for more ‘rise’ (or less fall, in other words) as it carries through the zone. Low-spin fastballs typically indicate the pitch has greater horizontal action, often making it tougher to square up, but generally easier to make contact with, leading to more ground balls, while high-spin fastballs show a correlation with swings and misses.
AVERAGE INDUCED VERTICAL BREAK
| Rank | Name | State | School | Class | Pos | IVB (avg) |
| 1 | Aaron Bailey | AL | McAdory High School | 2026 | 3B | 19.9 in |
| 2 | Dtric Butler | AL | Saraland | 2026 | RHP | 19.3 in |
| 3 | Jacob Driver | AL | Marbury | 2025 | RHP | 18.8 in |
| 4 | Will Fitzhugh | AL | Bayside Academy | 2027 | RHP | 18.5 in |
| 5 | Ty McGinley | AL | Fairhope | 2027 | SS | 17.3 in |
| 6 | Dylan Ackerman | AL | Daphne High School | 2025 | 1B | 17.1 in |
| 7 | Austyn Miller | AL | Cottonwood | 2025 | RHP | 16.8 in |
| 8 | Brooks McDonald | AL | Saint Paul's | 2025 | 1B | 16.7 in |
| 9 | Judson Harris | AL | Gulf Shores | 2027 | OF | 16.7 in |
| 10 | Kepler Lively | AL | Chilton County | 2024 | RHP | 16.4 in |
Induced Vertical Break: As far as deception and importance goes, fast induced vertical break (IVB) may be the most important. Induced vertical break is not what is sounds. IVB simply means the pitch is "breaking" upward from the average level a pitch falls from release to home plate. This is a stat that you want to stay away from being average at. Fortunately, this can be tweaked slightly depending on release height. To put it simply, the higher number = more "rise" the pitch has compared to average.
AVERAGE FASTBALL HORIZONTAL MOVEMENT
| Rank | Name | State | School | Class | Pos | HM (avg) |
| 1 | Jack Blanchard | AL | Daphne High School | 2026 | OF | 17.3 |
| 2 | Davis Ford | AL | Opelika | 2025 | LHP | -16.9 |
| 3 | Seth Turner | AL | Marbury | 2025 | OF | 14.5 |
| 4 | Tyler Johnson | AL | Opelika High School | 2025 | C | 14.3 |
| 5 | Alex Rippy | AL | Gulf Shores | 2024 | RHP | 13.6 |
| 6 | Brodie Wilson | AL | FAITH ACADEMY | 2027 | RHP | 13.6 |
| 7 | Harrison Cook | AL | Fairhope High School | 2025 | RHP | 13.2 |
| 8 | Ty Mabrey | AL | UMS-Wright Prep | 2027 | OF | 13.1 |
| 9 | Aiden Urnis | AL | Prattville High School | 2026 | SS | 12.1 |
| 10 | Benton Howell Jr | AL | Marbury | 2025 | LHP | -12.1 |
Horizontal Break: Outlined on TrackMan’s own website: “... horizontal movement is measured in inches between where the pitch actually crosses the front of home plate side-wise, and where it would have crossed home plate side-wise if had it traveled in a perfectly straight line from release. A positive number means the break was to the right from the pitcher’s perspective, while a negative number means the break was to the left from the pitcher’s perspective.”
AVERAGE CURVEBALL SPIN RATE
| Rank | Name | State | School | Class | Pos | Spin Rate (avg) |
| 1 | Brooks McDonald | AL | Saint Paul's | 2025 | 1B | 2624 rpm |
| 2 | Davis Ford | AL | Opelika | 2025 | LHP | 2507 rpm |
| 3 | Jacob Rowell | AL | Saraland | 2026 | RHP | 2495 rpm |
| 4 | Aaron Bailey | AL | McAdory High School | 2026 | 3B | 2400 rpm |
| 5 | Judson Harris | AL | Gulf Shores | 2027 | OF | 2323 rpm |
| 6 | Harrison Cook | AL | Fairhope High School | 2025 | RHP | 2300 rpm |
| 7 | Riley Wilemon | AL | Faith Academy | 2026 | RHP | 2266 rpm |
| 8 | Danny Lumpkin | AL | Bayside Academy | 2028 | RHP | 2162 rpm |
| 9 | Will Fitzhugh | AL | Bayside Academy | 2027 | RHP | 2133 rpm |
| 10 | Alex Rippy | AL | Gulf Shores | 2024 | RHP | 2108 rpm |
Spin Rate: The metric calculates how fast the ball is spinning as it leaves the pitcher’s hand, reported in the number of times the pitched ball would spin per minute (“revolutions per minute” or “rpm”).
AVERAGE SLIDER SPIN RATE
| Rank | Name | State | School | Class | Pos | Spin Rate (avg) |
| 1 | Jacob Rowell | AL | Saraland | 2026 | RHP | 2570 |
| 2 | Davis Ford | AL | Opelika | 2025 | LHP | 2462 |
| 3 | Parker Cranmore | AL | Daphne | 2027 | 3B | 2387 |
| 4 | Seth Turner | AL | Marbury | 2025 | OF | 2324 |
| 5 | Judson Harris | AL | Gulf Shores | 2027 | OF | 2236 |
| 6 | Danny Lumpkin | AL | Bayside Academy | 2028 | RHP | 2197 |
| 7 | Aaron Bailey | AL | McAdory High School | 2026 | 3B | 2191 |
| 8 | Dylan Ackerman | AL | Daphne High School | 2025 | 1B | 2140 |
| 9 | Benton Howell Jr | AL | Marbury | 2025 | LHP | 2041 |
| 10 | Jack Blanchard | AL | Daphne High School | 2026 | OF | 2040 |
Spin Rate: The metric calculates how fast the ball is spinning as it leaves the pitcher’s hand, reported in the number of times the pitched ball would spin per minute (“revolutions per minute” or “rpm”).
AVERAGE CHANGEUP HORIZONTAL MOVEMENT
| Rank | Name | State | School | Class | Pos | HM (avg) |
| 1 | Tyler Johnson | AL | Opelika High School | 2025 | C | 20.4 |
| 2 | Aiden Urnis | AL | Prattville High School | 2026 | SS | 18.9 |
| 3 | Jack Blanchard | AL | Daphne High School | 2026 | OF | 17.9 |
| 4 | Parker Cranmore | AL | Daphne | 2027 | 3B | 17.1 |
| 5 | Jordan Schreier | AL | Gulf Shores | 2028 | RHP | 17.1 |
| 6 | Brodie Wilson | AL | FAITH ACADEMY | 2027 | RHP | 16.8 |
| 7 | Benton Howell Jr | AL | Marbury | 2025 | LHP | -16.4 |
| 8 | Austyn Miller | AL | Cottonwood | 2025 | RHP | 16.1 |
| 9 | Landen Booth | AL | Mary G Montgomery | 2025 | RHP | 16.0 |
| 10 | Brooks McDonald | AL | Saint Paul's | 2025 | 1B | 15.9 |
Horizontal Break: This metric measures the distance, measured in inches, between where the pitch actually crosses the front of home plate side-wise, and where it would have crossed home plate side-wise if had it traveled in a perfectly straight line from release. A positive number means the break was to the right from the pitcher’s perspective, while a negative number means the break was to the left from the pitcher’s perspective.
PEAK EXIT VELOCITY (HITTING)
| Rank | Name | State | School | Class | Pos | Exit Velocity (max) |
| 1 | Drey Barrett | AL | Holtville | 2024 | SS | 101.1 mph |
| 2 | Judson Harris | AL | Gulf Shores | 2027 | OF | 100.2 mph |
| 3 | Edward Mcleod Jr. | AL | st. pauls episcopal | 2025 | 3B | 98.6 mph |
| 4 | Evan Lightsey | AL | American Christian | 2025 | 1B | 98.3 mph |
| 5 | Tyler Johnson | AL | Opelika High School | 2025 | C | 97.3 mph |
| 6 | Aaron Bailey | AL | McAdory High School | 2026 | 3B | 97.2 mph |
| 7 | Brady Richardson | AL | Enterprise High School | 2025 | SS | 96.7 mph |
| 8 | Bryce Rivers | AL | MOBILE CHRISTIAN SCHOOL | 2026 | 3B | 96.2 mph |
| 9 | Nolan Phillips | AL | Fairhope High School | 2024 | OF | 95.8 mph |
| 10 | Ethan Walls | AL | Stanhope Elmore High School | 2025 | 3B | 95.7 mph |
| 11 | Brooks McDonald | AL | Saint Paul's | 2025 | 1B | 95.3 mph |
| 12 | Riley Wilemon | AL | Faith Academy | 2026 | RHP | 95.3 mph |
| 13 | Brody Tuinder | AL | Mary G Montgomery | 2024 | OF | 95.1 mph |
| 14 | Tyler Martin | AL | Enterprise High School | 2025 | 3B | 94.4 mph |
| 15 | John Braswell | AL | Saint James | 2026 | 1B | 94.3 mph |
Exit Velocity: This metric measures the speed of the ball, measured in miles per hour, as it comes off the bat at the moment of contact.
PEAK ESTIMATED BATTED DISTANCE (HITTING)
| Rank | Name | State | School | Class | Pos | Distance (max) |
| 1 | Drey Barrett | AL | Holtville | 2024 | SS | 380 ft |
| 2 | Bryce Rivers | AL | MOBILE CHRISTIAN SCHOOL | 2026 | 3B | 364 ft |
| 3 | Christian Farni | AL | MOBILE CHRISTIAN SCHOOL | 2026 | OF | 361 ft |
| 4 | Nolan Phillips | AL | Fairhope High School | 2024 | OF | 359 ft |
| 5 | Tyler Johnson | AL | Opelika High School | 2025 | C | 356 ft |
| 6 | Ethan Walls | AL | Stanhope Elmore High School | 2025 | 3B | 355 ft |
| 7 | Edward Mcleod Jr. | AL | st. pauls episcopal | 2025 | 3B | 352 ft |
| 8 | Xavier Reyna | AL | Smiths Station | 2024 | OF | 351 ft |
| 9 | Brody Tuinder | AL | Mary G Montgomery | 2024 | OF | 344 ft |
| 10 | Aaron Bailey | AL | McAdory High School | 2026 | 3B | 344 ft |
| 11 | Carter McCammon | MS | Resurrection Catholic | 2025 | 3B | 342 ft |
| 12 | Maddox Eady | AL | Daphne High School | 2025 | OF | 339 ft |
| 13 | Tyler Martin | AL | Enterprise High School | 2025 | 3B | 339 ft |
| 14 | Joel Chandler | AL | Orange Beach MiddleHigh School | 2025 | SS | 337 ft |
| 15 | Cam Kerbl | AL | St. Michael Catholic | 2027 | C | 335 ft |
Distance: This metric measures the estimated “carry flat” distance, measured in feet, meaning the distance that the ball travels before it lands, or would have landed if it were not caught or obstructed.
+ Follow on Twitter: @PBR_Alabama
+ Follow on Instagram: @PBR_Alabama
+ Follow on Facebook: PBR Alabama
+ Click HERE to create a free profile.
+ Click HERE to purchase a subscription which gives you access to additional information on the site.
Related Content: