Trackman Traits- Hitting: 2022 C Jimmy Keenan (Iona Prep)
December 24, 2020
Welcome to the hitting side of Trackman Traits. In this series we will spotlight one player each week who stood out during this 2020 season and take a deeper dive into their numbers and take a look at some that really stand out. Since the implementation of the Trackman technology to our showcases this summer we have been fortunate enough to have seen a great deal of talent come through the system. Today, we will be taking a look at the number one backstop in New York's 2022 class, Jimmy Keenan.
Before we get started, we'll go over and define some of the terminology being used in the piece.
Exit Velocity- this one's pretty simple but this metric measures the speed of the ball off the bat, measured in miles per hour (mph).
Distance- another simple one, this metric measures how far the ball traveled or would travel if it was not obstructed, measured in feet.
Launch Angle- measures the vertical angle of the ball as it leaves the bat. Positive numbers represent balls traveling upward off of the bat and negative numbers mean the ball is traveling downward off of the bat.
Fly Ball %- Percentage of fly balls hit during a given set of batted ball events. Trackman defines a fly ball as any batted ball with a launch angle between 25 degrees and 49.9 degrees.
Line Drive%- Percentage of line drives hit during a given set of batted ball events. Trackman defines a line drive as any batted ball with a launch angle between 10 degrees and 24.9 degrees.
Hard Hit%- Percentage of batted balls with an exit velocity of 90 MPH or higher.
Bat Speed- The speed of the sweet spot of the bat at impact, measured in MPH. The sweet spot is measured 6 inches from the tip of the bat. - Blast Motion
Rotational Acceleration- A measure of how quickly the hitter gets from launch position to being on plane. This is measured in G-Force (g). - Blast Motion

Jimmy Keenan
Class of 2022 / C
Player Information
-
Graduating Class: 2022
-
Primary Position: CSecondary Position: 1B
-
High School: Iona PrepState: NY
- Summer Team: Long Island Titans
-
Height: 6-3Weight: 230lbs
- Bat/Throw: R/R
Statistics


Videos
(10/1/20)
Player News
- Year in Review - Top Catcher Arm Strength / Class of 2022 - Feb 3, 2021
- Year in Review - Top Bat Exit Velocity of 2020 / Class of 2022 - Jan 7, 2021
- Recruiting Board: St. John's University - Jan 3, 2021
- Trackman Traits- Hitting: 2022 C Jimmy Keenan (Iona Prep) - Dec 24, 2020
- Iona Prep Scout Day Spotlight: 2022 C/1B Jimmy Keenan - Oct 6, 2020
- NYS Games: Full Statistical Release - Jul 5, 2019
TRACKMAN DATA ANALYSIS
This event had a nice group of bats with 14 players registering an exit velocity of 85 mph or above, including 8 players who topped 90 mph. Keenan's 98.79 mph peak exit velocity was the leader in the clubhouse at the end of the day, showcasing his ability to hurt some baseballs and he did that as consistently as anyone that day as his 93.71 mph average exit velocity also led the group. What other categories did Keenan stand out in? He paced the event in these different Trackman categories:
| Rank | Name | State | School | Class | Pos | Exit Velocity (max) |
| 1 | Jimmy Keenan | NY | Iona Prep | 2022 | C | 98.8 mph |
| 2 | Trevor Dutra | NY | Iona Prep | 2021 | 1B | 95.9 mph |
| 3 | Jack Natter | NY | Iona Prep | 2022 | 3B | 94.7 mph |
| 4 | Peter Fasciglione | NY | Iona Prep | 2022 | SS | 94.4 mph |
| 5 | Jarred Jackette | NY | Iona Prep | 2022 | OF | 93.4 mph |
| Rank | Name | State | School | Class | Pos | Exit Velocity (avg) |
| 1 | Jimmy Keenan | NY | Iona Prep | 2022 | C | 93.7 mph |
| 2 | Peter Fasciglione | NY | Iona Prep | 2022 | SS | 89.9 mph |
| 3 | Trevor Dutra | NY | Iona Prep | 2021 | 1B | 88.6 mph |
| 4 | Ryan Bailey | NY | Iona Prep | 2024 | RHP | 86.1 mph |
| 5 | Jarred Jackette | NY | Iona Prep | 2022 | OF | 85.9 mph |
| Rank | Name | State | School | Class | Pos | Distance (max) |
| 1 | Jimmy Keenan | NY | Iona Prep | 2022 | C | 370 ft |
| 2 | Christian Rossi | NY | Iona Prep | 2023 | 3B | 338 ft |
| 3 | Peter Fasciglione | NY | Iona Prep | 2022 | SS | 338 ft |
| 4 | Jarred Jackette | NY | Iona Prep | 2022 | OF | 335 ft |
| 5 | Ellis Windheim | VA | Pro 5 Academy VA | 2023 | 1B | 334 ft |
| Rank | Name | State | School | Class | Pos | Distance (avg) |
| 1 | Jimmy Keenan | NY | Iona Prep | 2022 | C | 305 ft |
| 2 | Christian Rossi | NY | Iona Prep | 2023 | 3B | 236 ft |
| 3 | Jarred Jackette | NY | Iona Prep | 2022 | OF | 230 ft |
| 4 | Trevor Dutra | NY | Iona Prep | 2021 | 1B | 227 ft |
| 5 | Ethan Jaquette | NY | Bronxville | 2023 | SS | 221 ft |
| Rank | Name | State | School | Class | Pos | Hard Hit % |
| 1 | Jimmy Keenan | NY | Iona Prep | 2022 | C | 90 % |
| 2 | Trevor Dutra | NY | Iona Prep | 2021 | 1B | 60 % |
| 3 | Jarred Jackette | NY | Iona Prep | 2022 | OF | 55 % |
| ^ | Peter Fasciglione | NY | Iona Prep | 2022 | SS | 55 % |
| 4 | Ryan Bailey | NY | Iona Prep | 2024 | RHP | 25 % |
| ^ | Ellis Windheim | VA | Pro 5 Academy VA | 2023 | 1B | 25 % |
| 5 | Jack Natter | NY | Iona Prep | 2022 | 3B | 22 % |
Keenan's advanced strength was on display as he led the way in both max exit velocity and max distance for the event. Both encouraging numbers that indicate he's got some juice in his bat already, what stands out to me most is his ability to hit the ball hard consistently. He led the way in average exit velocity and average distance as well. Keenan finished as the only player who averaged over 90 mph exit velocity during the event, but that's not the only reason the '22 catcher hit the ball further than everyone on a consistent basis. He also hit the ball in the air more than all but one player at the event. He finished hitting 80% fly balls on the day, trailing only one player who put the ball in the air 87.5% of the time. This is not to say that hitting the ball in the air is what works best for every player. Players who hit the ball as hard as Keenan can are able to take advantage of hitting more fly balls because that high exit velocity leads to those fly balls getting over the heads of outfielders.
To take a look at the relationship between exit velocity and launch angle, we'll use one of my favorite tools, the Statcast Exit Velocity & Launch Angle Field Breakdown. This tool allows you to input an exit velocity and launch angle and it will generate a plot of all the times that exact combination happened in an MLB game and show the results of all of those specific batted ball events. To show the effect of increased exit velocity on fly balls, I compared what the outcomes of a ball hit with an 85 mph exit velocity and a 25 degree launch angle with the outcomes of a ball hit with a 95 mph exit velocity and a 25 degree launch angle.
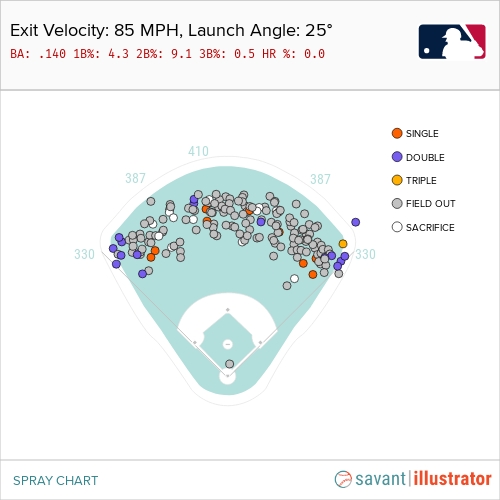
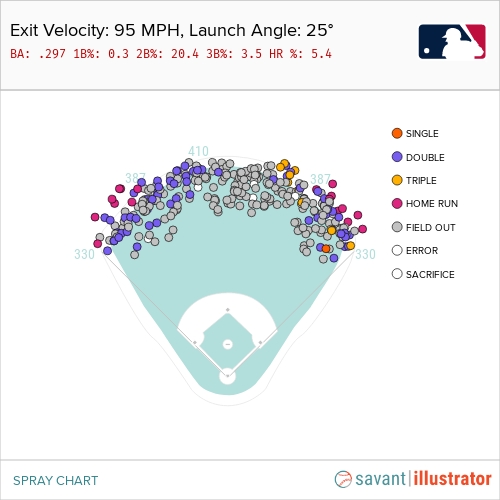
As you can see, the added 10 mph of exit velocity makes a big difference. When that exact combination of an 85 mph exit velocity with a 25 degree launch angle only resulted in an extra-base hit 9.6% of the time and led to a .140 batting average. With an added 10 mph in exit velocity, that batting average rises to .297 and extra-base hits have happened 29.3% of the time. Hitting the ball in the air is going to be much more beneficial to players like Keenan with higher exit velocities. This tool is a great way to get a visual understanding the relationship between exit velocity and launch angle and I recommend anyone who wants to learn that relationship in greater detail play around with it for a little while.
So, Keenan's ability to hit the ball hard pairs well with his fly ball tendencies. His exit velocity numbers support that and these charts display that there are plenty of extra-base opportunities should he continue to hit the ball in the air as hard as he did with the same level of consistency. To wrap it up, let's look at some more numbers that point to signs of consistency.
BLAST CONNECTION
Trackman does a great job showing the outcomes of players swings and their batted ball events. Its data is results based, the best numbers come when you get off your best swing and make your best contact. Blast Motion technology, also implemented at the same time this summer as the Trackman, tracks the swing data of a player and can shine a light into what a player does well in their swing. When paired with Trackman data, it can paint a more complete picture of a hitter and help explain why a player is able to hit the ball harder, farther, and more consistently than others.
Two Blast Motion metrics that we like to look at are bat speed and rotational acceleration. Rotational acceleration can be a good indicator of building bat speed through proper sequencing. Players who rotate better also have the ability to adjust their swings more effectively. Having higher rotational acceleration and bat speed numbers do not necessarily guarantee success at the plate, players can get away with having lower numbers in those areas and still excel at the plate. The benefit to having higher numbers in those categories allows for a greater margin of error. Having a higher bat speed allows a player that extra split-second where they can see the baseball out of the pitcher's hand before making a decision to swing. Having a higher rotational acceleration allows a player to make adjustments once they get the swing started, either to sit back for an off-speed pitch or check their swing on a breaking ball in the dirt.
Unsurprisingly, these were two metrics that Keenan was well above average in. Keenan showcased a peak bat speed of 77.5 mph, tops at the event. Following his trend of consistent big numbers, his average bat speed was 73.04 mph. His peak and average numbers both showcase his quick bat and that should help project well against increased velocity.
His rotational acceleration is another area he was above average in. Keenan's max was 23.6g while his average was 18.35g. These numbers both placed in the top 5 in their respective categories for the event.
CONCLUSION
When a player with the physicality that Jimmy Keenan has also shows the advanced bat speed and a high rotational acceleration like he does, it's no wonder he was able to punish baseballs as frequently as he did. Keenan's strong showing at the 2020 Iona Prep Gaels Scout Day made an impression on the Ground Forces crew on hand that day. It's always a joy to see an impressive BP round like Keenan put on display and we hope he'll continue to put on displays like that in the upcoming 2021 season.

UPCOMING EVENTS
The overview